
Let's cut through the jargon. Think of data science for business as a master detective for your company. Its job is to sift through all the clues—your company's information—to solve its biggest puzzles and, more importantly, predict what’s coming around the corner. This isn't some abstract academic exercise; it's about turning raw data into actionable insights and measurable profit.
Why Data Science Is Your New Business Superpower
At its heart, data science for business applies scientific methods, clever algorithms, and robust systems to pull real knowledge out of your data, whether it's neatly organized in a spreadsheet or scattered across unstructured documents. It's the engine that moves your company beyond just looking in the rearview mirror ("what happened") and into the driver's seat, with a clear view of the road ahead ("what will happen, and what should we do about it?").
This shift from reactive to proactive is what separates market leaders from everyone else.
Practical Example: Look at Netflix. They don't just use data to suggest your next binge-watch. They invest billions in new shows based on predictive models that analyze viewing patterns, genre popularity, and even the color palettes in successful films. That's data science in action—transforming a simple streaming service into a global content powerhouse by using data to de-risk massive investments.
Moving Beyond Basic Analytics
Your traditional Business Intelligence (BI) tools are great at what they do. They build dashboards showing past performance, answering critical questions like, "What were our sales last quarter?" This is essential information, but it’s fundamentally reactive. You're looking at history.
Data science, on the other hand, is proactive. It takes that same historical data and uses it to build models that forecast what’s next. It’s all about answering the forward-looking questions that truly shape your strategy:
- Customer Behavior: Which of our customers are most likely to leave in the next 90 days?
- Operational Efficiency: Which delivery routes will save us the most on fuel costs next month?
- Product Development: What new features should we build to get our users hooked?
Actionable Insight: A retail company can use BI to see that sales of winter coats dropped last January. Data science can take that a step further by building a model that predicts, based on weather forecasts and past sales data, exactly when to start discounting those coats to avoid excess inventory, turning a historical fact into a profitable, forward-looking action.
Data science bridges the gap between what your data says and what your business should do next. It’s the engine that powers informed risk-taking and intelligent growth, allowing you to make decisions based on probable outcomes, not just past results.
The True Impact on Your Bottom Line
Bringing data science into your operations isn't just a tech upgrade; it's a direct investment in your company's financial health. The value shows up in tangible ways across every department, from marketing and sales to logistics and finance. When you start making smarter, evidence-backed choices, you're building a more resilient and competitive organization from the ground up.
The ability to make these kinds of choices is the cornerstone of any successful modern business. As explored in our guide to data-driven decision-making, this approach provides a clear framework for turning insights into action, ensuring every major initiative is backed by solid evidence to cut down on guesswork and maximize success.
Ultimately, data science for business is no longer a luxury reserved for Silicon Valley giants. It’s become a core function, absolutely essential for boosting efficiency, creating fiercely loyal customers, and carving out a decisive competitive edge. It's the superpower that lets you see around corners and build your company's future with confidence.
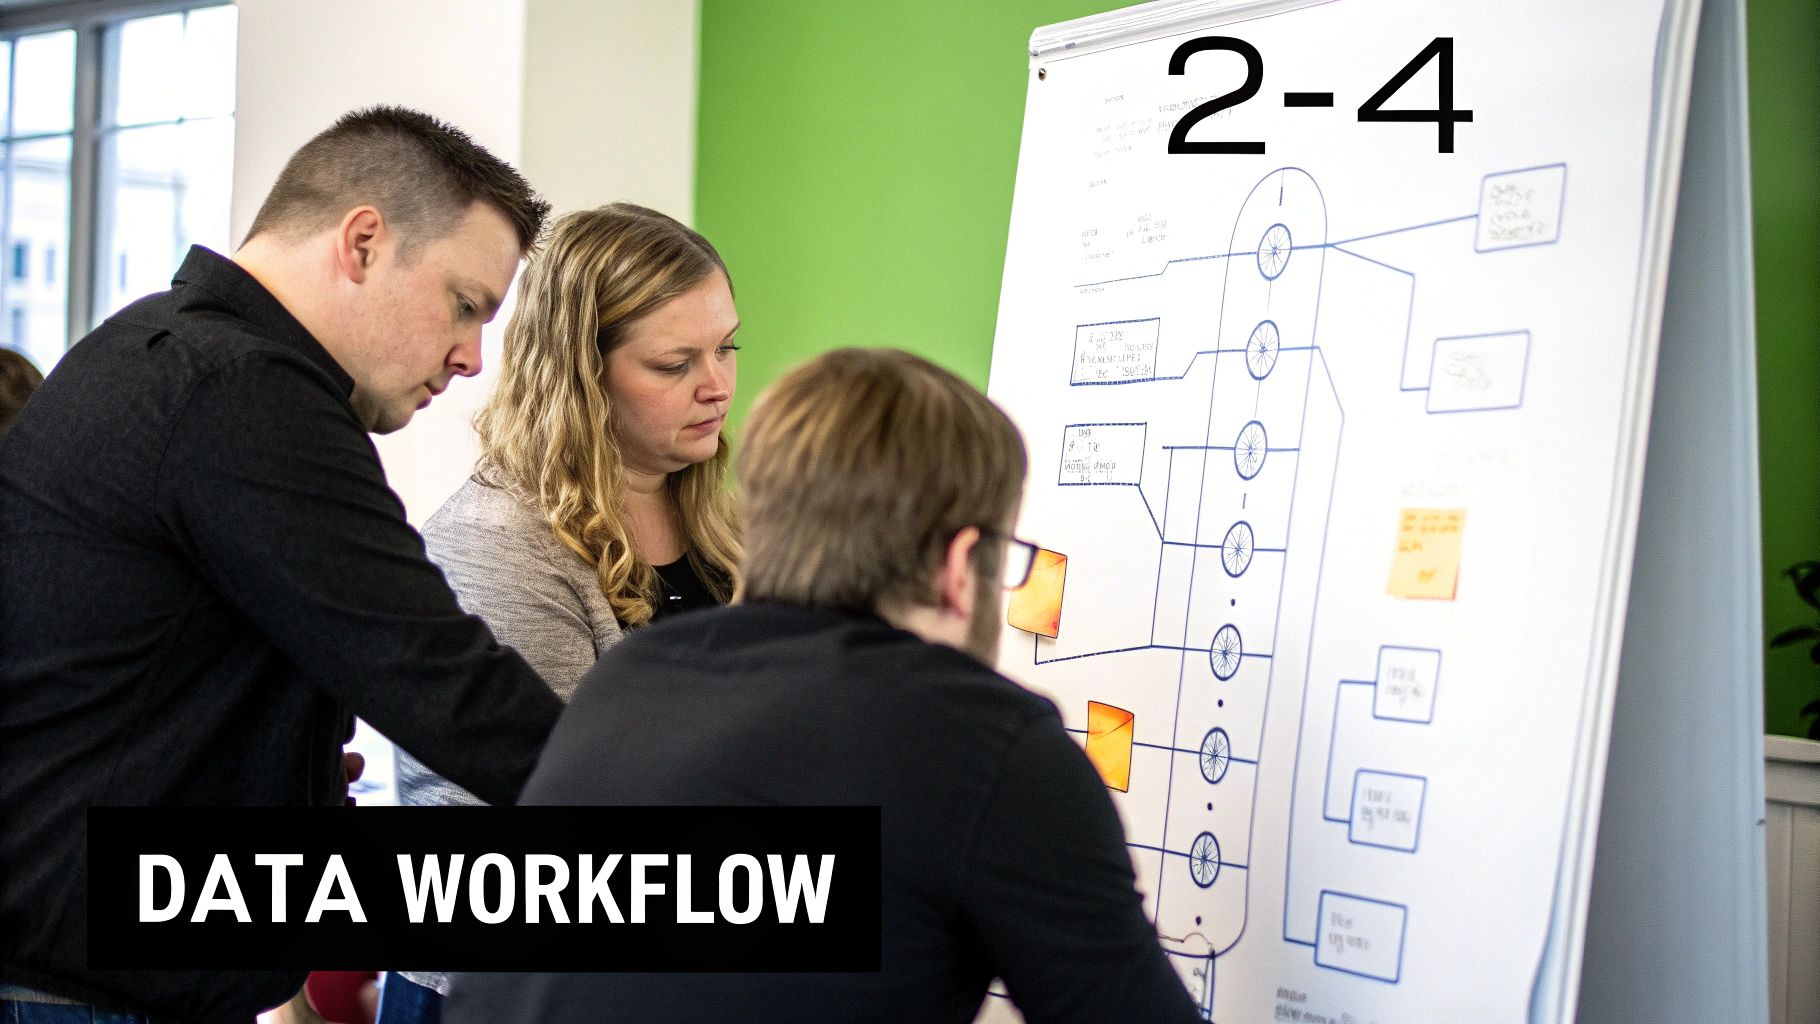
Building Your Data Science Dream Team and Toolbox

A powerful data science strategy doesn't just happen. It's carefully constructed around three core pillars: People, Process, and Technology. A common misstep is thinking you can just buy an expensive piece of software and call it a day. True success comes from building an ecosystem where the right talent uses a clear process and the best-fit tools to solve real business problems.
This section is all about how to assemble those components. It's not about having the biggest team or the flashiest software, but about creating the right blend to turn tough business questions into profitable answers. Let's break down what that looks like in the real world.
Assembling Your Core Team
Data science is a team sport. No single individual can master every part of the data lifecycle, from raw collection to a live predictive model. A high-performing data unit functions like a well-oiled machine, with each member playing a distinct but connected role. While the titles might shift from company to company, the core functions are always there.
-
The Data Engineer: Think of them as the architects and plumbers of your data world. They build the data highways—the pipelines—that move information from all over the business into one clean, reliable place. Without them, everyone else is stuck trying to make sense of a mess.
-
The Data Analyst: This is your mapmaker and translator. Analysts take the clean data, explore it to find trends, and build dashboards that clearly explain "what happened." They have a knack for turning complex numbers into straightforward business insights that leadership can act on right away.
-
The Data Scientist: The scientist is your future-caster. Using the clean data from engineers and historical insights from analysts, they build the predictive models that answer, "What's likely to happen next?" and "What's our best move?" They’re the ones behind the recommendation engines and fraud detection systems that drive proactive business decisions.
Actionable Insight: A common misconception is that you need to hire all three roles from day one. Many successful companies start with a sharp Data Analyst who can quickly show value. Their initial wins then justify bringing in more specialized engineering and science roles as the strategy grows.
Defining Your Process: A Simple Roadmap
A brilliant team with no direction will just spin its wheels. Without a clear process, data projects can quickly turn into disorganized "science experiments" that never deliver business value. A simple, practical framework ensures every initiative stays on track from the initial question to a deployed solution.
A time-tested model for this is the CRISP-DM (Cross-Industry Standard Process for Data Mining) framework. The name might sound a bit academic, but its steps are pure business logic.
- Business Understanding: Always start with the business problem, not a technical one. Practical Example: "We need to reduce customer churn by 10% in the next quarter."
- Data Understanding: Figure out what data you have and what you need. Do you have purchase histories, support tickets, and website activity logs?
- Data Preparation: This is where the Data Engineer works their magic, cleaning, transforming, and structuring the raw data so it's ready for modeling.
- Modeling: The Data Scientist steps in to build and test different models to predict which customers are most likely to churn.
- Evaluation: Before you roll anything out, you have to check your work. Is the model accurate? Will it actually help solve the churn problem?
- Deployment: Finally, the model gets integrated into the business—maybe by automatically sending a special offer to customers the model flags as "high-risk."
Choosing the Right Technology
Technology is the final piece of the puzzle, but it should always support your people and process, not the other way around. The modern data science for business toolbox is more accessible than ever, with a focus on flexible, integrated tools over giant, one-size-fits-all platforms.
A typical modern tech stack looks something like this:
- Core Languages: Python and R are the undisputed open-source champions for data manipulation, modeling, and analysis.
- Databases: Good old SQL databases are still vital for structured data, while cloud-based systems like Snowflake or BigQuery are built to handle enormous datasets.
- Business Intelligence (BI) Tools: Software like Tableau or Power BI gives Data Analysts the power to create interactive dashboards that anyone in the business can use.
- Cloud Platforms: Amazon Web Services (AWS), Google Cloud Platform (GCP), and Microsoft Azure provide the on-demand computing power and storage that serious data science requires.
Starting small with open-source tools is a smart and completely viable strategy. As we’ve explored in our guide to AI for small businesses, the key is to pick tools that solve your problems today but can easily scale with you tomorrow.
Real-World Data Science Wins Across Your Business
Theory is great, but results are what pay the bills. Let's move from the abstract "how" to the concrete "wow" by looking at how data science delivers real wins across different business departments. This isn't about fuzzy potential; it's about real companies solving expensive problems and unlocking new opportunities with data.
Each story here follows a familiar arc: a nagging business pain, the data science solution they used to fix it, and the bottom-line impact. Think of these as practical blueprints you can borrow inspiration from for your own organization.
Revolutionizing Marketing with Pinpoint Segmentation
Marketing teams know the frustration of wasted ad spend all too well. It’s easy to pour thousands into campaigns that cast a wide net, just hoping to catch the right customers. That "spray and pray" approach isn't just inefficient—it's expensive.
The Business Pain Point: An e-commerce fashion retailer was watching their return on ad spend plummet. Their campaigns were too generic and just weren't connecting with different customer groups, which led to sky-high acquisition costs.
The Data Science Approach: Instead of one-size-fits-all ads, they turned to a clustering algorithm (like K-Means) to make sense of their customer data. By analyzing purchase history, browsing behavior, and demographics, they uncovered distinct customer personas like "high-value loyalists," "seasonal bargain hunters," and "first-time gift buyers."
Actionable Insight: With these segments, the marketing team created targeted campaigns. "High-value loyalists" received early access to new collections, while "bargain hunters" were sent discount codes for last season's items. This personalized approach made the marketing feel relevant, not intrusive.
The Measurable ROI: By tailoring ad copy and special offers to each segment, the retailer slashed their customer acquisition cost by over 30%. Even better, the lifetime value of customers from these targeted campaigns shot up by 18%. It's a classic example of how smart models can drive better outcomes, a concept we dive into in our overview of AI business solutions.
Transforming Operations with Predictive Maintenance
In manufacturing and logistics, an unexpected equipment failure is a full-blown crisis. It slams the brakes on production, triggers massive delays, and racks up costly emergency repair bills. The old way of doing things—fixing machinery only after it breaks—is a recipe for chaos.
The Business Pain Point: A mid-sized logistics company was constantly battling unplanned downtime with its delivery truck fleet. Their maintenance was based on a rigid schedule that ignored the actual wear and tear on individual vehicles, leading to surprise breakdowns on the road.
The Data Science Approach: The company outfitted its trucks with IoT sensors to gather real-time data on everything from engine temperature and tire pressure to vibration patterns. A data scientist then built a predictive maintenance model that learned to spot the subtle data signals that pop up right before a component fails.
Practical Example: Instead of waiting for a breakdown, the system would now flag a vehicle with an alert like, "Truck 12 is 85% likely to have an engine failure in the next 7 days." This gave the team a chance to schedule proactive repairs during planned downtime.
The Measurable ROI: This pivot from reactive to predictive maintenance cut unexpected breakdowns by a massive 70% and lowered overall maintenance costs by 20%. This kind of big data analytics is a huge competitive advantage. In fact, studies show big data can slash maintenance expenses by up to 30%, and the market for it in sectors like retail and banking is expected to top a combined $18 billion by 2025.
Fortifying Finance with Real-Time Fraud Detection
Financial fraud is a persistent threat that can bleed a business dry. Traditional fraud detection systems often depend on static rules that are slow to adapt, frequently missing sophisticated new scams while also flagging legitimate transactions and frustrating good customers.
The Business Pain Point: A regional bank noticed a sharp spike in fraudulent credit card transactions. Their old rule-based system simply couldn't keep pace with the complex patterns modern fraudsters were using, resulting in heavy financial losses and eroding customer trust.
The Data Science Approach: The bank deployed a machine learning model to analyze transaction data in real time. For every single transaction, the model evaluated hundreds of variables—amount, location, time, purchase category—and instantly compared it against the customer's normal spending habits.
The Measurable ROI: The new AI-powered system detected 60% more fraudulent activity than the old one. At the same time, it reduced false positives—legitimate transactions flagged as fraud—by 40%. This dual victory not only saved the bank millions but also dramatically improved the customer experience by letting valid purchases go through without a hitch.
Your First Data Science Project: A Step-By-Step Playbook
Jumping into data science for business can feel like trying to boil the ocean. It's easy to get overwhelmed. The key is to start small, stay focused, and follow a clear plan. This playbook breaks down your first initiative into five manageable steps, designed to get you a tangible win and build momentum for everything that comes next.
This isn't about finding a perfect dataset and then hunting for a problem to solve with it. That’s backward. Instead, we’ll start with a real business pain point and use data as the tool to fix it. Let's walk through the exact steps to get you from an idea to a measurable business outcome.
Step 1: Pinpoint a High-Value Business Problem
The most common mistake people make is starting with a technical goal, like "Let's use machine learning." A successful project always, always begins with a business question. The best problems are specific, measurable, and tied directly to a key performance indicator (KPI) you already care about.
Actionable Insight: Run a workshop with key people from different departments—marketing, sales, operations, finance. Ask them one simple question: "If you could predict one thing to make your job easier or more effective, what would it be?" This conversation will uncover pain points with a clear path to ROI.
Practical Example: A weak problem is "We need better customer data." A high-value problem is "We need to identify which of our high-value customers are most likely to churn in the next 30 days so we can intervene." The second one is specific, measurable, and directly tied to revenue.
Step 2: Gather and Prepare Your Data
This is often the most time-consuming part of any data science project, but it's also the most critical. The quality of your model is completely dependent on the quality of your data. Think of it as mise en place for a chef; bad ingredients will ruin the final dish, no matter how skilled you are.
Your data is probably scattered across a few different systems:
- Customer Relationship Management (CRM): This is where you'll find customer interaction histories.
- Enterprise Resource Planning (ERP): This software holds your operational and supply chain data.
- Website Analytics Tools: These track how users behave on your site.
The goal here is to pull all this information together, clean it up, and get it structured. This means handling missing values, fixing inaccuracies, and formatting everything so a model can actually understand it. For a much deeper dive into this structured process, check out our guide on the complete data science project lifecycle.
Step 3: Build a Functional Proof-of-Concept Model
With your clean data ready to go, it’s time to start building. The objective here isn't to create a perfect, hyper-complex model on your first try. You're aiming for a Proof-of-Concept (PoC)—a simple, fast model that proves the idea is viable and can deliver real value.
To get started, you'll need the right tools. The infographic below shows just how popular the top three tools are in the data science world today.
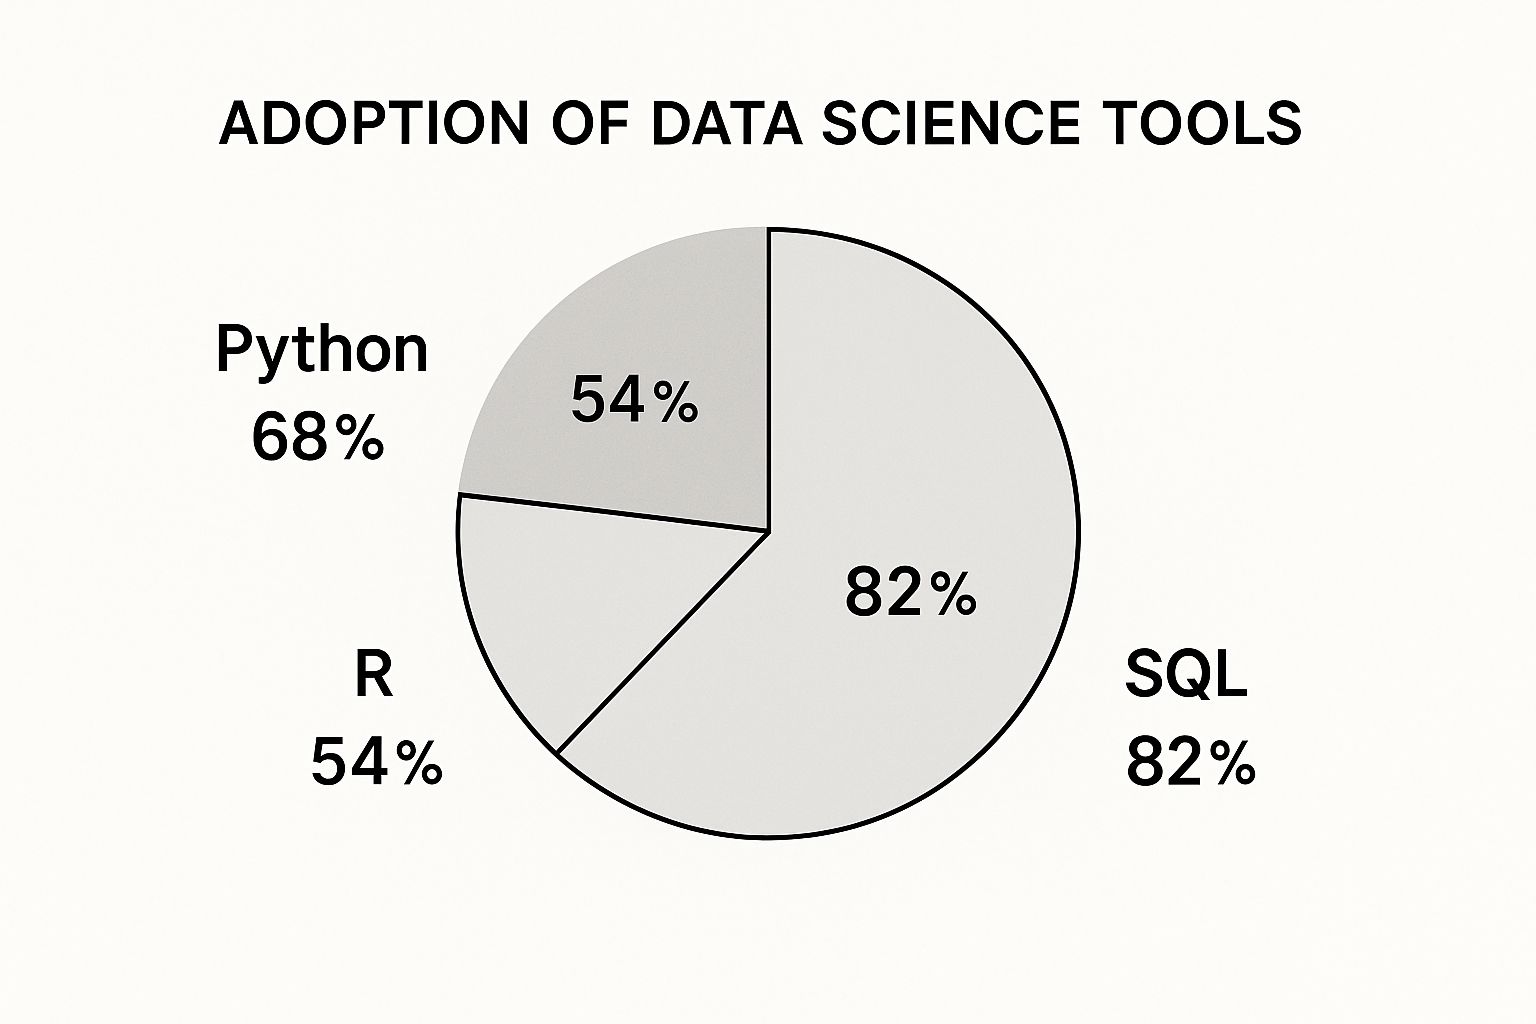
As you can see, SQL (82%) is the absolute foundation for getting data, while Python (68%) is the dominant language for actually building the models. These two are excellent starting points for your tech stack.
Step 4: Deploy the Solution and Measure Impact
A model just sitting on a data scientist's laptop provides zero business value. Deployment is where your model gets put to work in the real world. This could mean integrating it into your CRM to flag at-risk customers automatically or building a simple dashboard for the sales team to use.
Once it's live, measurement is everything. Go back and track the metrics you defined in Step 1. If your goal was to reduce churn, are fewer high-value customers actually leaving? You need to quantify the financial impact: how much revenue was saved? This data becomes your ammunition for justifying future projects. This focus is more critical than ever, with global surveys showing that 78% of organizations now use AI in at least one business function, with a projected economic contribution of $15.7 trillion by 2030.
Step 5: Iterate and Improve
Your first model is a starting line, not a finish line. Based on its real-world performance, you'll start to see areas for improvement. This loop—measure, learn, refine—is the very essence of applying data science successfully in a business. Maybe the model needs more data sources, or perhaps the algorithm itself could be fine-tuned for better accuracy.
Actionable Insight: Don't let the pursuit of perfection kill your first project. A "good enough" model that gets deployed quickly and delivers 80% of the potential value is far better than a "perfect" model that never leaves the lab. Your goal is to deliver business value, learn from the process, and build on that success.
How to Measure the True ROI of Your Data Science

Let's be blunt: a data science project without a clear return on investment (ROI) is just an expensive hobby. To get executive buy-in and secure future funding, you have to speak the language business leaders understand—dollars and cents.
This means moving past technical metrics like model accuracy and focusing on what really moves the needle: tangible gains in revenue, cost savings, and risk reduction.
When you calculate the ROI of your data science efforts, you're doing more than just justifying a budget. You're transforming data science from a "cost center" into a proven value driver. This is how you scale successful projects and embed a truly data-driven culture in your organization. A straightforward approach is often the most powerful.
A Simple Formula for Calculating Data Science ROI
At its core, ROI is a simple comparison of what you gained versus what you spent. For a data science project, you can use a clear, adaptable formula to make a compelling business case.
ROI Formula: (Financial Gain from Project – Cost of Project) / Cost of Project
The Financial Gain can come from increased revenue, lower operating expenses, or losses you managed to avoid. The Cost of Project includes everything from team salaries and software licenses to cloud computing fees. This simple equation grounds your project in business reality.
The key is to define both sides of this equation before the project even starts. This ensures you're tracking the right metrics from day one and can clearly report on the outcome. To learn more about structuring projects with a clear finish line in mind, check out our guide on the data science lifecycle, which highlights evaluation as a critical step.
Connecting Projects to Business Outcomes
To calculate a meaningful ROI, you must tie your initiative directly to a specific business goal. Different types of projects will impact the bottom line in different ways.
Here’s how to frame the value for a few common scenarios:
- Revenue Growth: A new pricing optimization model might lead to a 5% increase in average transaction value. The financial gain is the extra revenue you bring in over a set period.
- Cost Savings: An inventory management model that slashes overstocking could cut carrying costs by 15%. Here, the gain is the direct reduction in expenses.
- Risk Mitigation: A fraud detection system that stops $50,000 in fraudulent transactions each month provides a clear, quantifiable gain by preventing losses.
This tight focus on business outcomes is no longer optional; it's the standard. With the global AI market projected to hit $190.61 billion by 2025, businesses are digging into their data to find exactly these kinds of actionable insights.
Practical Example: Calculating Churn Prediction ROI
Let's walk through a real-world example to see this in action. Imagine an e-commerce company wants to reduce customer churn.
The Project:
Develop and deploy a churn prediction model to identify high-value customers who are at risk of leaving. The sales team will then reach out to these customers with a special retention offer.
Calculating the ROI:
-
Cost of the Project:
- Data Scientist Salary (3 months): $30,000
- Cloud Computing & Software: $5,000
- Total Project Cost: $35,000
-
Financial Gain (over one year):
- The model identifies 500 high-value customers at risk.
- The retention campaign successfully keeps 150 of them (a 30% success rate).
- The average annual value of each retained customer is $1,000.
- Total Revenue Saved (Gain): 150 customers * $1,000/customer = $150,000
-
Calculating the Final ROI:
- ROI = ($150,000 – $35,000) / $35,000
- ROI = $115,000 / $35,000 = 3.28
The project delivered a 3.28x ROI, or a 328% return. By retaining just a fraction of at-risk customers, the company generated more than three times its initial investment back in saved revenue. That’s a powerful case for expanding its data science program.
Your Practical Questions About Business Data Science Answered
Even with a clear roadmap, jumping into data science for business always brings up some tough, real-world questions. It’s one thing to see the potential, but it's another thing entirely to deal with the messy realities of budgets, hiring, and ethics.
This section tackles the most common questions and concerns we hear from business leaders. We’ll cut through the noise with clear, no-nonsense answers to help you get past the usual objections and move forward with confidence.
How Can a Small Business Start with Data Science Without a Huge Budget?
This is the big one, and the answer is to think small and targeted. You absolutely do not need a massive team or an enterprise software subscription to get value from your data. The trick is to pick a single, high-impact business problem and solve that first.
Forget about hiring a full-time team right away. Start with the tools you probably already have access to. Powerful open-source languages like Python and R are completely free. Your existing data, whether it's sitting in Google Analytics, your CRM, or even just old sales spreadsheets, is a goldmine of untapped insights.
Actionable Insight: Hire a freelancer for a short, well-defined project. Ask them to build a simple model that proves a concept. For instance, can they identify your most profitable customer segment? Or predict which marketing channel brings in the highest-value leads?
The goal here is a quick, tangible win. A small project that clearly saves money or boosts sales is the best possible way to get the internal buy-in you need to invest more later on. It’s about building a data-driven mindset, not a data center.
What Is the Difference Between a Data Scientist and a Data Analyst?
The lines can get blurry, but there’s a core difference in what they do. I find it helpful to think about it like building a car.
-
A Data Analyst is like the quality inspector who examines the finished car. They check the dashboards, test the performance, and report back with findings like, "Our sales were up 10% last quarter." They are experts at looking into the past to explain what happened.
-
A Data Scientist is the design engineer who uses physics, simulations, and data to build the engine for the next car. They predict future performance and suggest improvements, saying things like, "By redesigning this engine component, we can boost fuel efficiency by 15% on our next model." They use past data to build systems that predict and shape the future.
In short, analysts master descriptive analytics (what happened), while scientists focus on predictive and prescriptive analytics (what will happen and what to do about it). Both roles are critical for a mature data strategy, but knowing their unique contributions is key. For anyone looking to grasp the core principles that both roles rely on, exploring data science fundamentals is an excellent starting point.
What Are the Biggest Ethical Risks We Should Be Aware Of?
Using data science in business comes with serious responsibilities. Getting the ethics wrong can destroy your brand, land you in legal trouble, and evaporate customer trust. The three biggest risks to keep on your radar are data privacy, algorithmic bias, and a lack of transparency.
-
Data Privacy: This goes beyond just being compliant with regulations like GDPR or CCPA. You have to be upfront with your customers about what data you’re collecting and how you’re using it. Trust is everything.
-
Algorithmic Bias: This is a subtle but incredibly dangerous risk. An AI model is only as good—and as unbiased—as the data it’s trained on. Practical Example: If your historical hiring data reflects past societal biases, a model trained on that data will learn to repeat those same mistakes, such as favoring candidates from certain universities or backgrounds. You must actively audit for and stamp out bias to ensure fairness.
-
Lack of Transparency: When a model makes a critical decision, you need to be able to explain why. This is often called "Explainable AI," and it's essential for accountability. If your model denies someone a loan, you have to know which factors drove that outcome to ensure it was fair and to provide a clear reason.
Where Should We Look for Our First Data Science Project?
My best advice? Don't start with the data. Start with a real business pain point. The most successful projects are always born from solving problems that keep your department heads up at night.
Actionable Insight: Get your leaders in a room and ask them direct questions:
- "Which one of our processes is painfully slow or overly manual?"
- "Where are we consistently losing money or wasting resources?"
- "What's the single biggest complaint we hear from our customers?"
Listen for problems where better predictions could have a direct, measurable financial impact. You'll often find great starting points in marketing (like improving ad targeting to cut waste), sales (predicting which leads are actually likely to close), or operations (optimizing inventory to reduce carrying costs). Pick a project where the data is relatively easy to get and the potential ROI is simple enough for anyone in the company to understand.

