
When we talk about data-driven decision making, we're really talking about a fundamental shift in how businesses operate. It’s the practice of grounding your strategic choices in hard facts, metrics, and data, rather than relying purely on intuition. This isn't about ignoring experience; it's about backing it up with evidence to make smarter, more accurate decisions that lead to actionable results.
What Is Data-Driven Decision Making?

Think of it this way: a seasoned pilot has thousands of hours of flight time. That experience gives them an incredible "feel" for the aircraft. But when a storm hits, they don't just rely on their gut. They depend on their cockpit instruments—real-time data on altitude, airspeed, and weather patterns—to navigate safely. This data provides the actionable insight needed to make a critical decision: change course, adjust altitude, or land.
Data-driven decision making (DDDM) is the business equivalent. It’s the strategic partnership between human expertise and analytical insights. You're not letting an algorithm run the show blindly. Instead, you're giving your team the instruments they need to see clearly, validate their instincts, and make confident choices that drive action.
The Shift From Intuition To Insight
For a long time, leadership was synonymous with having a good "gut feeling." Experience and personal judgment were the primary tools. While invaluable, this approach has its limits. It’s prone to personal biases and blind spots. A data-driven culture doesn't throw that experience away; it supercharges it with actionable evidence.
This isn’t just a passing trend—it’s fast becoming the standard. A study of leading companies found that 73.5% of managers and executives now describe their decision-making as consistently data-driven. Even more telling, 25% of organizations make nearly all their strategic moves based on data, a clear pivot away from pure intuition. You can dig deeper into these data-driven decision making statistics to see just how widespread this has become.
By anchoring decisions in provable evidence, organizations can finally test old assumptions, challenge outdated beliefs, and pivot with real agility. It’s the difference between saying, “I think this will work,” and, “The data shows a 20% lift when we do this, so we are taking this action.”
Intuition vs. Data-Driven Decision Making
So what does this look like in practice? The difference in mindset is night and day. Moving from an intuition-first to a data-first culture requires understanding where each approach shines and falls short.
Here’s a clear comparison of the two styles.
| Aspect | Intuition-Based Approach | Data-Driven Approach |
|---|---|---|
| Foundation | Relies on personal experience, anecdotal evidence, and "gut feelings." | Relies on collecting and analyzing relevant data, metrics, and facts. |
| Bias | Highly susceptible to personal biases, emotional influences, and cognitive shortcuts. | Reduces personal bias by grounding decisions in objective, verifiable information. |
| Scalability | Hard to replicate or scale, as it depends on an individual's unique judgment. | Creates a consistent, repeatable process that can be applied across teams. |
| Action | Tends to be reactive, based on what worked or failed in the past. | Drives proactive strategies by identifying trends and predicting future outcomes for clear action. |
| Justification | Decisions are defended with subjective reasoning, like "It just feels right." | Decisions are justified with clear evidence, supporting metrics, and a solid rationale. |
Ultimately, a data-driven approach doesn’t mean you stop thinking. It means you start with a foundation of facts, which empowers you to ask better questions and arrive at more reliable answers. It's about making your next big move with confidence, not just a hunch.
How a Data-First Culture Transforms Your Business
Making a "data-first" culture part of your business isn't just a technical upgrade—it's a complete shift in strategy that gives you a serious competitive edge. When an entire organization learns to speak the language of data, decisions get sharper, strategies become more precise, and growth feels more consistent. It’s the difference between making educated guesses and building a predictable engine for success.
The real change is moving from reacting to market shifts to anticipating them. Instead of basing next year's budget on last year's numbers, teams can use predictive models to actually forecast demand. Rather than guessing which marketing message works, they A/B test campaigns and let the numbers declare the winner. This commitment to evidence over gut feeling is what separates market leaders from everyone else.
From Data Points to Profitability
Embracing data-driven decision making has a direct impact on the bottom line. It's how organizations find and fix inefficiencies, pinpoint their most profitable customers, and optimize pricing with almost surgical precision. This isn't just theory; the results are real and they are massive.
Research into data-driven companies paints a pretty clear picture. Businesses that embed data into every decision, interaction, and process see wildly better outcomes. They are a staggering 23 times more likely to acquire customers, 6 times more likely to retain them, and 19 times more likely to be profitable than their less data-focused competitors. You can dig into these findings in more detail in McKinsey's research on the data-driven enterprise. These aren't small gains. They show that a data-first culture isn't a luxury—it's a modern necessity for staying in the game.
A data-first culture re-engineers an organization's DNA. It empowers everyone, from the C-suite to the front lines, to ask "What does the data say?" before making a critical move.
Actionable Insight in Practice
So, what does this actually look like day-to-day? Imagine a retail company struggling with inventory piling up in some stores while others run out of popular items. Sales are sluggish. Instead of relying on a store manager’s gut feeling, they decide to build a strategy grounded in data.
They start by pulling together different data streams:
- Point-of-Sale (POS) Data: What's selling, when it's selling, and what products are bought together.
- In-Store Foot Traffic Sensors: Tracking how shoppers move through the store, where they linger, and which displays they completely ignore.
- Online Purchase History: Connecting a customer's digital browsing and buying habits with what they do in the physical store.
- Inventory Levels: Watching stock in real-time across all locations to prevent stockouts or overstock situations.
By meshing these datasets, the company starts to uncover real, actionable insights. They might discover that customers who buy a specific brand of coffee online are highly likely to purchase a new line of insulated mugs if they see them placed near the checkout. Or they might find that a high-traffic aisle is actually a bottleneck, causing frustrated shoppers to leave empty-handed.
Armed with this information, the retailer can take decisive action:
- Store Layout Redesign: They reorganize aisles based on how people actually walk through the store, not how they think they do.
- Personalized Promotions: They send targeted offers to loyalty members for products they've viewed online but haven't bought yet.
- Dynamic Inventory Management: They use predictive analytics to automatically restock popular items right before they run low, tailored to each store’s unique sales patterns.
This isn't just an interesting academic exercise. It's a direct path to higher sales, less waste, and happier, more loyal customers. The retailer is no longer guessing what customers want—they are responding to what the data is clearly telling them. This is the power of a data-first culture in action.
Your Actionable Framework for Making Data-Driven Decisions
Trying to build a data-driven culture without a clear process is a recipe for frustration. It’s easy to get bogged down by endless spreadsheets and conflicting numbers, a situation often called "analysis paralysis." You know there are answers in the data, but you can't seem to find them.
A structured framework is the antidote. It gives your team a repeatable roadmap to follow, turning raw information into confident, strategic moves. To make this tangible, let's walk through it with a real-world example.
Imagine you're on the marketing team for an e-commerce company. You've just discovered a scary trend: customer churn jumped by 15% last quarter. Your goal is to figure out why and, more importantly, how to stop it.
This process shows you exactly how to put your data to work, moving from a mess of numbers to a clear course of action.
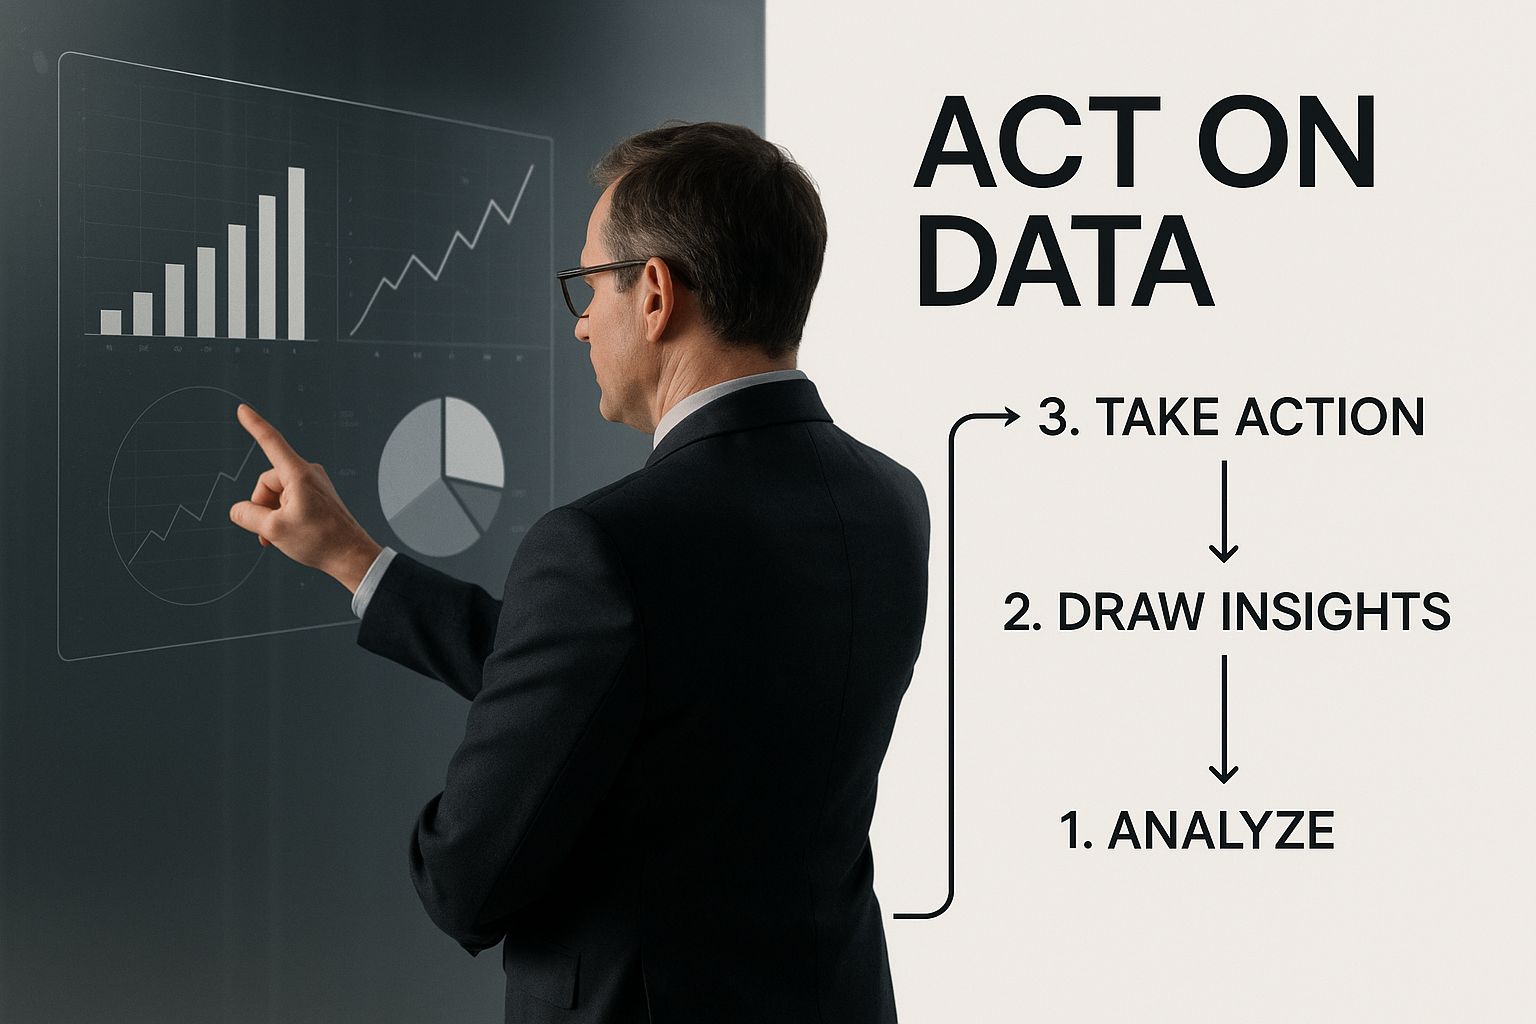
The whole point of analytics isn't just to analyze; it's to find insights that you can actually act on.
Stage 1: Clearly Define Your Business Question
Before you even think about touching a piece of data, you have to know exactly what problem you're trying to solve. Vague goals like "improve customer satisfaction" are a dead end because you can't measure them. A good business question is specific, measurable, and tied directly to a business outcome.
Our e-commerce team's problem is rising churn. They need to get more specific. Instead of asking a broad question like, "Why are customers leaving?", they need to formulate sharp, testable hypotheses.
- Are certain customer segments churning more than others?
- Is there a link between negative customer service interactions and churn?
- Do customers who face shipping delays tend to leave more often?
These precise questions give the entire investigation a clear focus.
Stage 2: Collect High-Quality, Relevant Data
With your questions in hand, it's time to gather the right data. This means identifying all the potential internal and external sources that could hold a piece of the puzzle. The key here is relevance. Don't just collect everything you can find; that's a surefire way to get overwhelmed.
Our churn-fighting marketing team would start pulling data from a few key systems:
- Customer Relationship Management (CRM): For customer demographics, purchase history, and contact details.
- Customer Support Tickets: To get data on issue types, how long it took to resolve them, and satisfaction scores.
- Website Analytics: To see user behavior like last login dates or abandoned carts.
- Logistics Database: To track shipping and delivery times.
By stitching these sources together, they can build a 360-degree view of the customer journey and start spotting the friction points that lead people to leave.
Stage 3: Clean, Process, and Analyze the Data
Raw data is almost always a mess. It's full of duplicates, missing values, typos, and other inconsistencies. This stage—which often takes up the most time—is all about cleaning and organizing the data so you can trust the answers you get from it.
Once the data is clean, the real analysis begins. This is where you test your initial hypotheses. Our team might find a strong correlation between customers whose support tickets stayed open for more than 48 hours and their likelihood to churn. They might also see that customers who haven't logged in for over 30 days are at a very high risk.
The goal is to unearth patterns that directly answer your business question.
A data-driven decision is only as reliable as the data it’s built on. Skipping the cleaning and processing phase is like building a house on a shaky foundation—it’s bound to crumble.
Stage 4: Visualize Insights and Tell a Story
Numbers on a spreadsheet rarely inspire anyone to take action. To make your findings stick, you need to turn them into a compelling story backed by clear visuals. Things like dashboards, charts, and graphs make complex information digestible for everyone, from data analysts to the CEO.
The marketing team wouldn't just present a spreadsheet. Instead, they’d build a dashboard featuring:
- A bar chart breaking down churn rates by customer segment.
- A timeline graph showing how churn spiked right after a recent change to the shipping policy.
- A scatter plot correlating customer satisfaction scores with the probability of churn.
This visual story makes the "why" behind the churn impossible to ignore and points directly toward a solution. This entire journey, from question to action, mirrors the structured approach detailed in our guide to the Data Science Lifecycle, which provides a deeper look into these project stages.
Stage 5: Take Action and Iterate
This is the final—and most crucial—step. All the brilliant analysis in the world is worthless if it just sits in a report on someone's desktop. Based on their findings, the marketing team can now propose concrete actions.
For example, they might launch a targeted re-engagement campaign for at-risk customers and work with the support team to bring down ticket resolution times.
But the work isn't done. Data-driven decision-making is a continuous loop, not a one-time project. After implementing these changes, the team must measure the results. Did churn go down? Did customer satisfaction tick up? This feedback loop is what drives continuous improvement and helps refine your strategies over time.
Essential Tools and Technologies for Modern Analytics
Modern data-driven decision making doesn’t happen in a vacuum—it's powered by a strong technology stack. To get from raw numbers to actionable insights, you need the right tools. But this doesn’t mean you need a team of Ph.D.s or a budget the size of a small country. Many of these technologies are more accessible than ever, designed to put powerful analytics into more hands.
Think of these tools as the engine of your data strategy. Just like a race car needs a powerful engine to win, your organization needs the right technologies to keep up with the volume and speed of modern data. These tools handle everything, from gathering information to presenting it in a way that guides your next big move.
Core Technologies Powering Insight
The world of data analytics is constantly growing, driven by advancements that make it possible to process information faster and uncover deeper insights. This rapid expansion is fueling a market projected to hit $132.9 billion by 2026. This explosive growth is largely thanks to a few key technologies that have become central to any serious data strategy. To get a better sense of what's coming next, check out the current and future trends in data analytics.
Here are the cornerstones of a modern analytics stack:
-
Cloud Computing Platforms: Services like Amazon Web Services (AWS), Google Cloud Platform (GCP), and Microsoft Azure provide the scalable infrastructure needed to store and process huge datasets. They eliminate the need for costly on-premise servers and offer flexible, pay-as-you-go models that make advanced analytics affordable for businesses of all sizes.
-
Data Warehousing and Lakes: Think of a data warehouse as a highly organized library for your structured data (like sales figures and customer records). A data lake, on the other hand, is a vast repository that can hold all kinds of data in its raw format—from emails and social media posts to sensor readings. Both are essential for centralizing information.
-
Data Integration and ETL Tools: Getting data from various sources (like your CRM, website, and ad platforms) into one place is a major challenge. ETL (Extract, Transform, Load) tools automate this process. They pull data, clean it up, and load it into your data warehouse, ensuring you have a single source of truth for analysis.
The goal of this technology stack isn’t just to collect data, but to create a seamless flow of information from its source to the decision-maker. Without automation, this process quickly becomes a bottleneck.
Making Data Actionable with AI and Visualization
Once your data is collected and organized, the next step is to find the meaning hidden within it. This is where artificial intelligence (AI), machine learning (ML), and data visualization come into play, turning complex datasets into clear, actionable directives.
Practical Example: Predictive Forecasting in E-commerce
Imagine an e-commerce business gearing up for the holiday shopping rush. In the past, they might have relied on last year’s sales data and a bit of guesswork to stock inventory. This old way of doing things often led to costly mistakes—either running out of popular items and losing sales or being stuck with excess stock that had to be heavily discounted.
Today, that same business uses AI and machine learning for predictive forecasting. An ML model sifts through years of sales history, current market trends, social media sentiment, and even competitor pricing. It doesn't just look at what sold last year; it identifies complex patterns to predict future demand with remarkable accuracy.
The AI might forecast a 35% spike in demand for a specific winter coat based on an unusually cold weather forecast and a recent surge in social media chatter. Armed with this insight, the company confidently adjusts its inventory orders. They meet customer demand without overstocking. This is data-driven decision making in action—using technology to move from reactive to proactive.
The Last Mile: Visualization and Automation
Analysis alone isn't enough. The insights must be communicated clearly to the people who can act on them.
-
Data Visualization Platforms: Tools like Tableau, Power BI, and Google Looker Studio are critical for telling a story with data. They transform raw numbers into interactive dashboards, charts, and graphs. This makes it easy for even non-technical stakeholders to understand trends, spot outliers, and grasp the key takeaways instantly.
-
Automated Data Pipelines: The entire process—from data collection to visualization—can be streamlined. By building automated data pipelines, information flows from its source to a dashboard with minimal human intervention. This ensures decision-makers always have access to fresh, up-to-date insights. You can explore our guide on automated data pipelines to learn how to build these efficient systems.
Real-World Examples of Data-Driven Success
It’s one thing to talk about frameworks and theories, but the real magic of data-driven decision-making happens when you see it in the wild. Watching companies move from abstract ideas to concrete results is where the true power of this approach comes alive. The following stories show how different organizations turned raw data into a serious competitive advantage.
These aren't just feel-good stories about collecting data. They're case studies in solving a pressing problem by gathering the right information, analyzing it with a clear goal, and producing a tangible, measurable business outcome.
Optimizing Logistics With Real-Time Fleet Data
A national logistics company was staring down a classic industry nightmare: fuel costs were spiking, and delivery windows were getting tighter, squeezing their profit margins to almost nothing. Their routes were planned using old, static data that couldn't adapt to the chaos of the real world—traffic jams, unexpected road closures, or last-minute delivery changes.
-
The Problem: Inefficient routes meant they were burning through fuel, missing deadlines, and leaving customers frustrated. They needed a way to adapt on the fly.
-
The Data: The company outfitted its entire fleet with GPS trackers and IoT sensors. This created a firehose of real-time data, streaming everything from vehicle location and speed to engine health and fuel consumption.
-
The Analysis: Using advanced analytics software, they crunched this live data against real-time traffic feeds and weather reports. The system was smart enough to spot a bottleneck as it formed and instantly calculate a better route for any driver.
-
The Actionable Insight: The analysis provided an actionable directive: reroute trucks in real-time to avoid congestion. The system didn't just report traffic; it prescribed the optimal new path for each driver, turning a data point into a direct command.
-
The Outcome: The impact was immediate. Within six months, they achieved a 15% reduction in fuel consumption. Delivery times got 22% faster, and customer satisfaction scores jumped. The data didn't just give them a report; it created a living, self-correcting delivery network.
This example perfectly illustrates that data-driven decision-making isn't just about looking backward. It’s about building intelligent systems that react to the present to make the future more efficient.
Refining Treatment Protocols in Healthcare
In healthcare, good data can literally save lives and improve patient outcomes. A large network of clinics suspected that inconsistencies in how their doctors treated a common chronic illness were leading to wildly different results for patients.
-
The Problem: Patient outcomes were all over the map, and there was no evidence-backed standard for the most effective treatment plan.
-
The Data: The provider aggregated and analyzed thousands of anonymized patient records. They looked at everything: demographics, other health conditions, specific treatments prescribed, how well patients stuck to them, and, crucially, their health outcomes over time.
-
The Analysis: Data scientists used statistical analysis to hunt for correlations. They hit gold, discovering that a small tweak in a medication plan, combined with a targeted patient education program, led to a 30% higher success rate.
-
The Actionable Insight: The finding wasn't just interesting; it was a clear blueprint for action. The insight was to create a new, standardized protocol based on the most successful treatment combination identified in the data.
-
The Outcome: Armed with this insight, the clinic network rolled out a new, standardized protocol. This data-backed approach not only led to better patient care but also cut costs by reducing complications from less effective treatments.
Personalizing Marketing With Machine Learning
A retail brand was tired of shouting into the void with generic marketing blasts. They knew personalization was the future but had no idea how to predict what each customer actually wanted to buy.
The brand turned to machine learning models to segment its audience not just by who they were, but by what they were likely to do next. As we cover in our guide to machine learning in marketing, this unlocks a new level of relevance. They analyzed everything from purchase history and website clicks to email engagement to build a predictive profile for every single customer.
This allowed them to send hyper-targeted offers. A customer who bought running shoes would get an email about new arrivals in that specific category, while someone else who browsed hiking gear would receive a tailored message about outdoor equipment. This shift from a one-size-fits-all approach to a one-to-one conversation resulted in a 40% increase in email open rates and a 25% jump in conversion rates from those campaigns.
Overcoming Common Challenges in DDDM
Making the switch to data-driven decision making is a huge step forward, but let’s be honest: it’s rarely a clean, straight line from A to B. It’s a journey. And like any worthwhile journey, it has its share of bumps and detours.
I’ve seen plenty of organizations start this process with a ton of excitement, only to get bogged down by messy data, internal friction, or simply not having the right people for the job. The good news? These roadblocks are incredibly common, and there are proven ways to navigate around them.
Overcoming Key Implementation Hurdles
Here’s a secret: the biggest barriers to a data-driven culture usually aren't technical. They're human. Things like resistance to change, untrustworthy data, and skill gaps can create a perfect storm that sinks even the best-laid plans.
- Poor Data Quality: Your decisions are only as good as the data you feed them. If your data is incomplete, wrong, or locked away in different departments, your analysis will be flawed, and people will quickly lose faith in the whole process.
- Organizational Resistance: People are creatures of habit. You can’t expect teams to just drop their trusty "gut-feel" methods overnight. Pushing a new, data-first approach often brings out skepticism and sometimes, outright opposition.
- Analytics Skills Gap: You might be swimming in data, but do you have people who know what to do with it? Without skilled analysts, you risk misinterpreting the numbers or getting stuck in "analysis paralysis," where no one can make a decision.
The real challenge isn't just about collecting data. It's about shifting the entire organization's mindset to trust and act on what that data says. Moving from "what we think is right" to "what the data shows is right" takes patience, proof, and a whole lot of persistence.
Launching Pilot Projects to Build Momentum
So, how do you win over the skeptics and get the ball rolling? Start small. One of the most powerful things you can do is run a small-scale pilot project that delivers a quick, high-impact win. Forget about a massive, company-wide overhaul on day one. Instead, pick one specific, well-defined problem and solve it with data.
Practical Example: A Pilot Project in Action
Let’s say you have a marketing department that’s hesitant to go all-in on data. The VP of Marketing is a big believer in creative intuition and isn't sold on the numbers. This is your chance to build a bridge. Propose a small-scale pilot.
The goal: Reduce ad spend waste on a single social media campaign.
- Isolate the Problem: Don't try to fix all of marketing at once. Focus only on one campaign on one platform—say, a Facebook campaign for a new product.
- Gather Focused Data: Collect the key performance metrics: click-through rates (CTR), cost-per-click (CPC), and conversion rates. Slice this data by ad creative, target audience, and time of day.
- Analyze and Act: The data quickly shows a clear pattern: ads running after 9 PM have a sky-high CPC but almost zero conversions. The insight is simple and actionable: turn off ad delivery during those hours.
- Showcase the Win: You go back to the VP with a clear result: a 15% reduction in campaign spend with absolutely no drop in sales. This is a small but undeniable victory that proves the financial power of data-driven decision making.
Suddenly, you have a powerful internal case study. That VP is now much more likely to try this on other campaigns. You've created momentum. Managing these kinds of projects is a skill in itself, which is why having a solid framework is key.
Common DDDM Pitfalls and How to Avoid Them
As you move forward, you'll inevitably face some common traps. Being aware of them is half the battle. This table breaks down the most frequent pitfalls I’ve seen and offers practical advice to help you steer clear.
| Common Pitfall | Best Practice Solution |
|---|---|
| Analysis Paralysis | Start with a single, clear business question. Focusing your efforts prevents you from getting lost in endless data exploration. |
| Ignoring Data Quality | Implement a data governance policy. Ensure data is cleaned and validated before analysis to build a foundation of trust. |
| Data Silos | Centralize your data sources. Use integration tools to create a single source of truth that gives everyone a complete picture. |
| Lack of Buy-In | Start with small wins. Use pilot projects to demonstrate clear ROI and build enthusiasm and support from key stakeholders. |
| Focusing on Metrics, Not Insights | Tell a story with your data. Use visualization tools to translate numbers into a compelling narrative that points to clear actions. |
Think of this table as your field guide. By anticipating these issues and applying these best practices, you can keep your data initiatives on track and build a culture that truly values evidence over opinion.
Frequently Asked Questions About Data-Driven Decision-Making
It's natural to have questions when your organization starts leaning more heavily on data. Let's tackle a few of the most common ones to give you the confidence to move forward.
How Can a Small Business Start With Data-Driven Decision-Making?
You don't need a massive budget or a dedicated data science team to get started. The key is to begin with a single, high-impact business question.
Instead of a vague goal like "increase sales," get specific. Ask something like, "Which of our marketing channels delivers the highest customer lifetime value?" You can use free tools like Google Analytics to track website behavior or dig into the analytics your email marketing platform already provides. Start small, aim for a quick win to prove the value, and then build from there.
What Is the Difference Between Data-Informed and Data-Driven?
This is a great question, and the distinction, while subtle, is important.
Being data-driven means the data is the primary, almost exclusive, factor in a decision. If the analysis points to a clear answer, that's the path you take. It's a very objective, numbers-first approach.
A data-informed approach, on the other hand, treats data as a critical input alongside other factors. Your team might use data to frame a problem and understand the landscape, but the final call still weighs things like team experience, customer intuition, and qualitative feedback.
Which Roles Are Essential for Building a Data-Driven Team?
To build a truly capable team, you need a mix of skills. At the start, a Data Analyst is absolutely crucial. This is the person who will get their hands dirty cleaning, analyzing, and visualizing data to answer those pressing business questions.
As your organization matures, a Data Engineer becomes essential. They are the architects who build and maintain the robust systems that collect, store, and make data accessible for everyone else.
Of course, both of these roles depend on a solid data infrastructure. Understanding strong data architecture principles is what allows you to build a foundation that is both scalable and reliable, supporting the entire team's efforts for years to come.
At DATA-NIZANT, we provide expert analysis and in-depth articles on AI, data science, and more to help you turn information into action. Explore our insights at https://www.datanizant.com.

