
If you want to turn raw information into real-world business impact, you need a roadmap. The data science lifecycle is that proven blueprint, guiding a project from a vague business question all the way to a deployed, value-generating solution. It’s what keeps teams from getting lost in the weeds and ensures they consistently deliver actionable insights.
What Is the Data Science Lifecycle?
Think of the data science lifecycle like building a custom house. You wouldn’t just show up with a hammer and start nailing boards together randomly, right? Of course not. You'd follow a methodical process. First, you work with an architect to create a blueprint (that’s your business understanding). Next, you source high-quality materials (data collection) and pour a solid foundation (data preparation). Only then do you start framing the house (modeling), bring in an inspector (evaluation), and finally, hand the keys to the new owner (deployment).
This systematic approach is what separates successful projects from chaotic, failed experiments. It turns a complex undertaking into a series of manageable, logical steps. Without this structure, projects often crumble due to poorly defined goals, messy data, or models that don't actually solve the problem they were built for. The lifecycle isn't rigid—it's a flexible framework that's meant to be iterative.
Why a Structured Lifecycle Matters
A structured lifecycle is the secret ingredient that separates successful data science initiatives from expensive science projects. It creates a common language and clear stages that everyone—from data engineers to business stakeholders—can understand and follow. This alignment is vital for translating business needs into technical requirements and, just as importantly, translating technical results back into business value.
The process generally breaks down into six core stages, and following them is critical. In fact, businesses that are highly data-reliant are about three times more likely to report significant improvements in their decision-making. You can get a deeper look at how this structure drives results with these insights on the data science lifecycle.
To give you a better sense of how it all starts, the diagram below shows a simplified view of the initial data ingestion process—a crucial first step for any project.
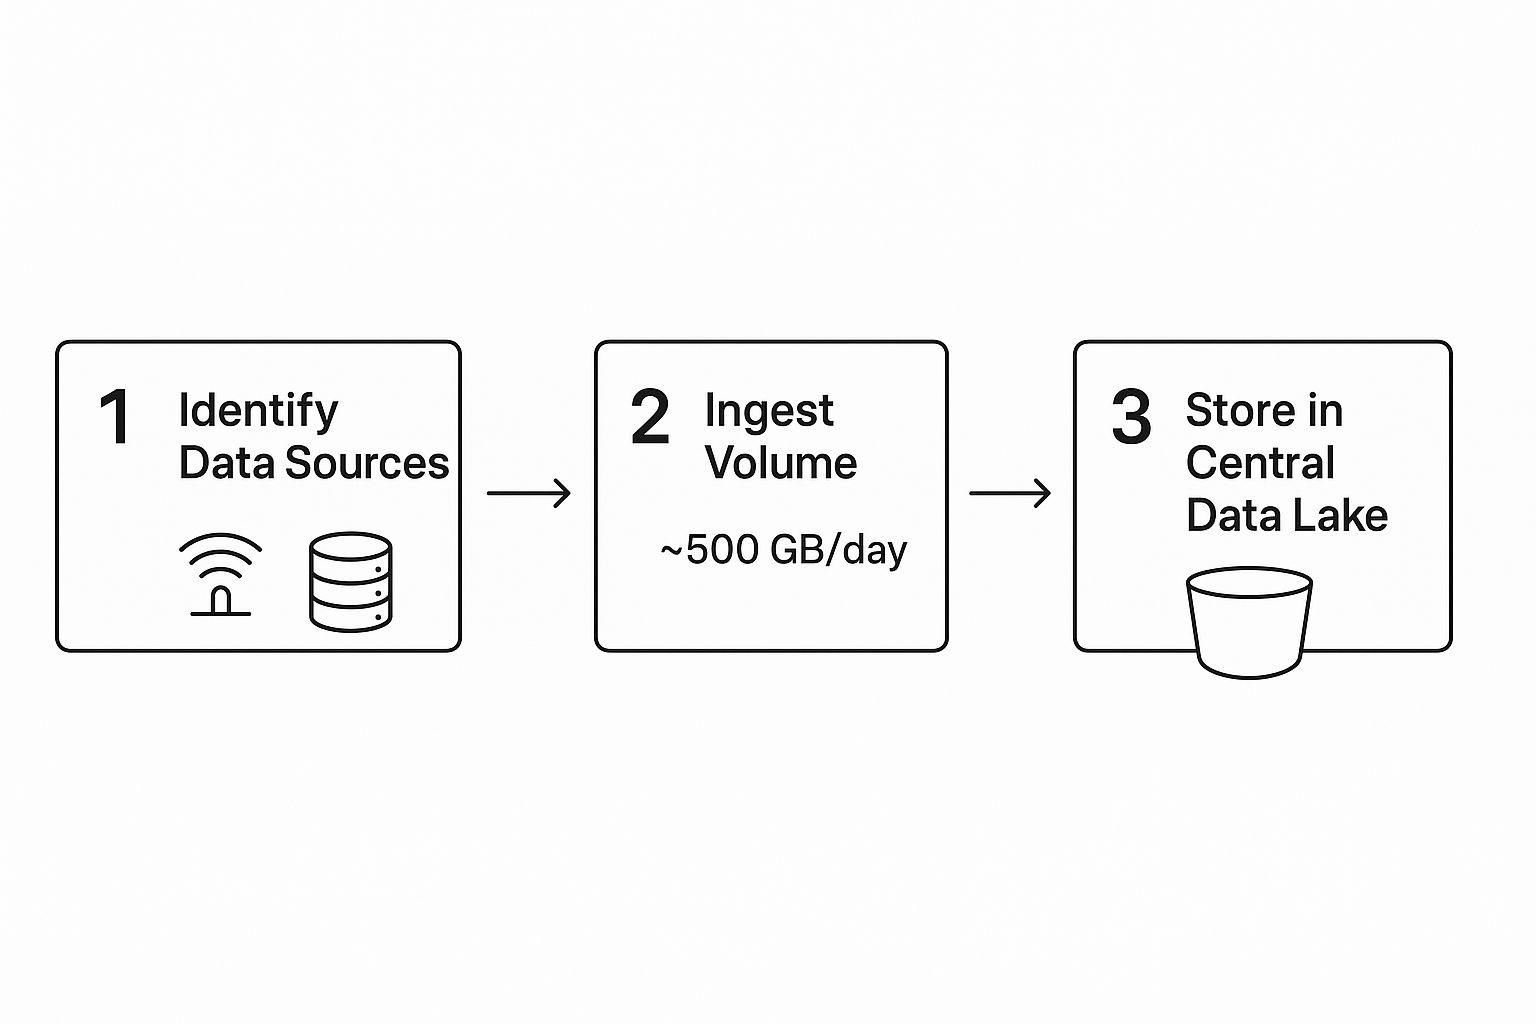
As you can see, data from different sources is identified, brought in, and centralized in a data lake for analysis. This is just the beginning. Each stage of the lifecycle builds on the success of the one before it, ensuring the final model is constructed on a solid foundation of clean, relevant, and well-understood data.
To make this even clearer, let's break down each of these stages and its main goal.
The Core Stages of the Data Science Lifecycle
| Stage | Primary Objective | Actionable Insight |
|---|---|---|
| 1. Business Understanding & Problem Definition | Clearly define the project goals, scope, and success metrics. | Transform a vague goal like "improve marketing" into a specific, measurable question like "Which marketing channel yields the highest customer lifetime value?" |
| 2. Data Collection & Exploration | Gather raw data and perform initial analysis to understand its structure and quality. | Discover that 70% of customer complaints come from a single product line, pointing to a quality control issue. |
| 3. Data Preparation & Cleaning | Transform raw data into a clean, structured format suitable for modeling. | Standardize country codes ("USA", "U.S.", "United States") into a single format to ensure accurate geographical analysis. |
| 4. Modeling | Select and train machine learning models to find patterns and make predictions. | Train a regression model to forecast next month's sales, allowing inventory managers to stock appropriately and avoid shortages. |
| 5. Evaluation | Rigorously test the model's performance to ensure it meets the initial business objectives. | Confirm a fraud detection model has high recall, ensuring it catches most fraudulent transactions even if it means a few legitimate ones are flagged for review. |
| 6. Deployment & Monitoring | Integrate the model into a production environment and continuously monitor its performance over time. | Set up alerts that trigger when a product recommendation engine's click-through rate drops by 10%, signaling the need for retraining. |
This table provides a high-level overview, but the real magic happens in the details of each step. Let's dive into what each of these six stages actually involves.
Defining the Problem and Exploring Your Data
Every worthwhile data science project kicks off with two critical steps: defining the problem and getting to know your data. A project without a clear question is like setting sail without a map—you're moving, but you're not actually getting anywhere useful. This initial phase is where business sense meets data exploration, and it lays the foundation for everything that follows.
A vague goal like "improve sales" is a classic recipe for failure. It's too broad to act on and impossible to measure. The real work is to sharpen that vague idea into a question data can actually answer.
A well-defined problem is a problem half-solved. In data science, this means translating a business need into a concrete, measurable objective that data can tackle head-on.
Practical Example: Instead of "improve sales," a better approach is to ask:
- "Which customer segments are most likely to churn in the next quarter?" This is a classification problem. The actionable insight is identifying at-risk customers for targeted retention campaigns.
- "Can we forecast monthly revenue for our top-selling product for the next six months?" This is a regression problem. The actionable insight is optimizing inventory and cash flow based on the forecast.
- "Which marketing channels bring in our highest lifetime value customers?" This is an attribution and analysis problem. The actionable insight is reallocating marketing spend to the most effective channels.
Getting this specific from the start dictates the data you'll need, the models you’ll eventually build, and how you’ll know if you've succeeded.
Gathering and Exploring Your Raw Materials
Once you have a clear question, it's time to gather the data. This raw information is the fuel for your project and can be pulled from all sorts of places. Businesses today often have data scattered across multiple systems, which makes a solid data architecture essential for keeping things flowing smoothly. You can see how companies build these systems in our guide to modern data architecture.
Common data sources include:
- Internal Databases: SQL databases holding sales records, customer information, or product inventory.
- CRM Systems: Platforms like Salesforce are treasure troves of customer interactions, support tickets, and sales pipeline data.
- APIs: These let you pull real-time data from external services, like social media platforms or weather services.
- Public Datasets: Government agencies, universities, and sites like Kaggle offer open datasets that can add valuable context to your analysis.
Uncovering Insights with Exploratory Data Analysis
With your data in hand, you move into one of the most creative stages: Exploratory Data Analysis (EDA). Think of yourself as a detective arriving at a crime scene. You aren't trying to solve the case just yet; you're dusting for fingerprints, spotting initial patterns, and noting anything that seems out of place (like anomalies or outliers).
The goal of EDA is to build a deep, intuitive feel for your dataset. This involves using statistical summaries and, more importantly, visualizations to understand its core characteristics.
A Practical Example of EDA
Let's imagine an e-commerce company wants to reduce customer churn. After defining the problem, they gather data on purchases, website activity, and support tickets. Now, the data science team begins EDA to hunt for clues.
Using a Python library like Pandas, they start with some basic stats:
- The average number of purchases per customer.
- The time since each customer's last interaction.
- The frequency of support ticket submissions.
Next, they fire up visualization libraries like Matplotlib or Seaborn to bring the data to life:
- A histogram of purchase frequency might immediately show a huge group of customers who only ever buy once. Actionable Insight: This suggests a potential issue with customer retention after the first purchase. A loyalty program could be a potential solution.
- A scatterplot comparing "time since last login" against "total money spent" could reveal that high-value customers who haven't logged in for 30 days are at a high risk of churning. Actionable Insight: This defines a specific, at-risk segment. The marketing team can now create a re-engagement campaign targeting these exact users.
- A box plot might highlight a few strange outliers, like a customer with an impossibly high number of support tickets, pointing to a data quality issue that needs fixing.
This initial exploration doesn't produce a final model, but it provides something just as valuable: direction. It helps form early hypotheses, uncovers messy data, and guides the next steps, ensuring the project stays on the right track from the very beginning.
Preparing and Engineering High-Quality Data

Alright, we've defined our problem and taken a first look at the data. Now we step into what is, without a doubt, the most critical phase of the entire data science lifecycle. This is where we roll up our sleeves and transform raw, messy data into the pristine, structured fuel our machine learning model will run on.
Ask any data scientist, and they'll tell you this part is a beast. It's notorious for being the most time-consuming step, often eating up a staggering 80% of a project's timeline. But there are no shortcuts here. The old saying "garbage in, garbage out" is the absolute, ruthless truth in data science. Feed a state-of-the-art algorithm flawed data, and it will fail. Every single time.
This phase boils down to two core activities: data preparation (or cleaning) and feature engineering. Together, they make sure our model gets information that is accurate, consistent, and packed with predictive power. The challenge is only growing, with about 149 zettabytes of data being generated in a recent year, a figure projected to climb to 394 zettabytes by 2028. This explosion of information from sensors, phones, and countless other devices makes getting this stage right more important than ever. If you want more context on these numbers, you can review key data science statistics and see their impact on the field.
From Messy to Model-Ready Data Preparation
Here’s a hard truth: real-world data is never clean. It arrives full of holes, typos, weird formatting, and duplicate entries. The first job is to systematically fix this mess. This isn't just about blindly deleting bad data; it's about making smart, strategic decisions to salvage as much valuable information as possible.
Practical Example: A sales dataset has a revenue column with missing values.
- Poor approach: Delete every row with a missing
revenuevalue. You lose potentially valuable information about those customers. - Better approach (imputation): Fill the missing
revenuevalues with the average revenue for that customer's specific product category. This preserves the record while using a logical substitute.
Common data preparation tasks include:
- Handling Missing Values: Using techniques like imputation (filling gaps with a mean, median, or more sophisticated statistical method) to preserve data.
- Correcting Inconsistencies: Standardizing categorical entries like "USA," "U.S.," and "United States" into a single, consistent value.
- Removing Duplicates: Eliminating identical records that can skew a model's learning and lead to biased, unreliable results.
These cleanup steps are non-negotiable for building a dataset you can trust. For a much deeper dive into these techniques, our comprehensive guide on data preprocessing for machine learning provides detailed, actionable steps.
The Art of Feature Engineering
Once the data is clean, the real magic begins. This is feature engineering, a process where we use domain knowledge and a bit of creativity to transform existing data into new features that speak the model's language. The goal is to make the underlying patterns in the data more obvious to the algorithm.
Feature engineering is the alchemy of data science. It’s where you turn raw, leaden data points into golden features that give your model its predictive power.
This is where a simple data point is elevated into something that provides true, actionable insight.
A Practical Example in E-Commerce
Imagine you have a dataset of customer transactions. One column is purchase_date. As a raw timestamp, it's not very useful to a model. But with some clever feature engineering, we can extract a goldmine of new, high-value features from it:
- Day of the Week: Did the purchase happen on a weekday or a weekend? This could uncover patterns about work-week vs. leisure shopping.
- Time Since Last Purchase: How many days have passed since this customer’s last order? This is a fantastic indicator of engagement and potential churn.
- Seasonal Features: Did the purchase occur during a major holiday season like Christmas or Black Friday?
- Purchase Frequency: How many times has this customer bought something in the last 30 days?
Actionable Insight: By creating the Time Since Last Purchase feature, you've given the model a direct signal for churn. The model can now learn a rule like: "If Time Since Last Purchase > 90 days, the customer is 85% likely to have churned." This is a clear, actionable rule the business can use.
Building and Training Your Machine Learning Model
So, you’ve meticulously prepped your data. Now for the exciting part—the stage where you actually build and train your machine learning model. Think of this as constructing the engine for your solution. All the groundwork—defining the problem, gathering data, and cleaning it—was like sourcing the best parts and mixing the perfect fuel. It's finally time to put it all together.
This is where your abstract business goal starts to become a tangible, working algorithm. The most important decision you'll make here is picking the right type of model for the job. You wouldn't use a hammer to turn a screw, and the same logic applies here. You have to match the algorithm to the problem you’re trying to solve.
Choosing the Right Algorithm
The algorithm you select flows directly from the question you defined back in stage one. Are you trying to predict a number? Classify an outcome? Or maybe group similar things together? Each of these tasks calls for a completely different family of models.
Here are a few common scenarios you'll run into:
- Regression Problems: This is your go-to when you need to predict a numerical value.
- Practical Example: Predicting the sale price of a house based on its square footage, number of bedrooms, and location. A Linear Regression model is often a great place to start.
- Classification Problems: Use this when you need to predict a category or a class.
- Practical Example: Deciding if an email is "spam" or "not spam." Logistic Regression is a classic choice for this type of binary classification task.
- Complex Classification or Regression: When the relationships in your data are far more intricate and non-linear.
- Practical Example: Figuring out which customers are at high risk of churning based on dozens of behavioral variables. Here, you'd reach for a more robust algorithm like a Random Forest or a Gradient Boosting Machine.
Choosing the right algorithm is a real skill. If you're looking to get a deeper understanding of the different models and, more importantly, when to use them, our guide offers a clear path to machine learning mastery that will help you make much better decisions.
A Practical Example: Training a Model
Let's bring this to life. Imagine we’re that e-commerce company trying to predict which customers will churn. We have our clean dataset ready to go, with features like time_since_last_purchase and purchase_frequency. Our goal is to train a classification model.
Before we even touch the model, there's a critical step: splitting our data. We can't use the same data to both train the model and test how well it works. That would be like giving a student the answer key before an exam—sure, they’d score 100%, but we wouldn't have a clue if they actually learned anything.
To get a true measure of performance, we split our data into two distinct parts:
- Training Set: This is the bigger chunk, usually 70-80% of the data. The model learns all the patterns and relationships from this set.
- Testing Set: This is the smaller, unseen portion (20-30%). We hold this back to evaluate how well our trained model performs on new data it has never encountered before.
This train-test split is your fundamental defense against overfitting. Overfitting happens when a model just memorizes the training data instead of learning the underlying patterns. When that occurs, it fails spectacularly on new data.
With Python's popular Scikit-learn library, this whole process is surprisingly straightforward. You'd import a model, like RandomForestClassifier, and then "fit" it to your training data. This "fitting" is the learning process, where the algorithm tunes its internal knobs to best map your input features to the target outcome (churn vs. no churn).
Once it's trained, we unleash the model on our testing set to see how accurately it makes predictions. The results from this test will tell us if our model is truly ready for the next stage: evaluation.
5. Evaluating and Deploying Your Model for Impact
So you've built a model. That's a huge step, but a trained model sitting on your laptop is just a clever algorithm. It only starts creating real value once it’s out in the wild, making decisions and influencing outcomes. This is where evaluation and deployment come in—the final, critical stages where all your hard work gets put to the ultimate test.

Simply training a model and calling it a day isn't enough. You have to rigorously prove it works, and that means measuring its performance against the business goals you defined way back in stage one. This goes way beyond a single accuracy score, which can be dangerously misleading. True evaluation is about picking the right yardstick for the job.
Choosing the Right Performance Metrics
For any model to be useful, it has to excel at the metrics that actually matter to the business. A model that's 99% accurate sounds incredible, right? But what if that 1% error represents a catastrophic failure, like a missed medical diagnosis or a fraudulent transaction slipping through? This is exactly why a deep understanding of evaluation metrics is non-negotiable.
The metrics you choose depend entirely on what your model is built to do—predict a number (regression) or assign a label (classification).
- For Classification Tasks: We look beyond simple accuracy. Metrics like precision, recall, and the F1-score give us a much richer story about the types of mistakes our model makes.
- For Regression Tasks: Here, it’s all about how close our predictions are to the real values. Key metrics include Mean Absolute Error (MAE), which tells you the average size of your errors, and Root Mean Squared Error (RMSE), which penalizes larger errors more heavily.
It's also crucial to confirm that your model's performance isn't just a statistical fluke. To get a better handle on this, you should explore concepts like statistical significance and confidence intervals, which are foundational for validating any data-driven conclusion.
Practical Example: Why Metrics Can Be a Matter of Life and Death
Imagine you’ve built a model to help doctors spot a rare but aggressive form of cancer. Here’s why your choice of metric is so critical:
- Precision answers: "Of all the patients we flagged as having cancer, how many actually did?" High precision means fewer false alarms (false positives).
- Recall answers: "Of all the patients who truly had cancer, how many did our model correctly identify?" High recall means fewer missed cases (false negatives).
In this scenario, a missed diagnosis (low recall) is infinitely more dangerous than a false alarm. You would need to build a model with the highest possible recall, even if it means some non-cancerous patients get flagged for a follow-up test. Actionable Insight: The business decides to optimize for recall, accepting that a 5% false positive rate is a worthwhile trade-off to catch 99.9% of actual cancer cases.
Model Evaluation Metrics For Common Tasks
| Model Type | Key Metric | Best Used When… |
|---|---|---|
| Classification | Accuracy | The classes are balanced and you care equally about all errors. |
| Classification | Precision | The cost of a false positive is high (e.g., flagging a safe email as spam). |
| Classification | Recall | The cost of a false negative is high (e.g., missing a fraudulent transaction). |
| Classification | F1-Score | You need a balance between Precision and Recall. |
| Regression | MAE | You want an error metric that is easy to interpret and in the same units as the target. |
| Regression | RMSE | You want to heavily penalize large errors. |
Choosing the right metric isn't just a technical detail; it's about aligning your model's definition of "good" with the real-world consequences of its predictions.
From Evaluation to Production Deployment
Once you’re confident your model is ready, it's time for the main event: putting it into production. Deployment is the technical process of plugging your model into an existing business system where it can start making predictions automatically. This step is what bridges the gap between a data science project and tangible business impact.
There are a few common ways to get a model out into the world:
- As a REST API: This is a popular and flexible method. You can wrap your model in a lightweight web framework like Flask or FastAPI, creating an endpoint that other applications can call to get predictions in real-time.
- Integrated into a BI Dashboard: For analytical models, the insights might be fed directly into a tool like Tableau or Power BI. This lets business users explore the model's findings within a familiar environment.
- As a Batch Process: Not all models need to be live 24/7. A customer segmentation model, for instance, might only need to run once a week to update customer profiles in a CRM.
MLOps and Monitoring for Long-Term Value
Deployment isn’t the finish line—it’s the start of the model’s life in the real world. And the world changes. Customer behavior shifts, markets evolve, and new data patterns emerge. A model that was a star performer last month could quietly become inaccurate over time. This slow decay is known as model drift, and it's why MLOps (Machine Learning Operations) is so important.
MLOps is the discipline of managing the lifecycle of machine learning models in production. It combines best practices from software engineering (DevOps) and data science to automate the processes of deployment, monitoring, and retraining, ensuring models stay reliable and accurate over time.
Practical Example: A retail company deploys a model to predict demand for winter coats. It performs beautifully in the fall. But as spring approaches, customer interest plummets. An MLOps monitoring system detects that the model's prediction accuracy has dropped below an acceptable threshold. This automatically triggers an alert for the data science team to retrain the model with more recent sales data, preventing the company from overstocking winter wear in April. This final phase is what separates a one-off project from a sustainable, value-generating AI system.
Navigating Real-World Data Science Challenges
The data science lifecycle looks clean on a whiteboard—a neat, logical progression from one stage to the next. But in the real world? Projects are rarely so tidy. They’re often messy, unpredictable, and full of hurdles that can derail your progress if you aren't ready for them.
Successfully managing a project means you have to anticipate these challenges. The path from a raw dataset to a deployed model is littered with potential roadblocks, from technical glitches to simple human communication breakdowns. Being ready for these issues is what separates the projects that succeed from the ones that stall out.
Tackling Data and Stakeholder Hurdles
Two of the most persistent challenges I see are poor data quality and misaligned stakeholder expectations. Even after you think you’ve finished the initial cleaning, you might uncover deeper issues with data integrity that only pop up during modeling. This discovery often forces a frustrating retreat to the data preparation stage, eating up valuable time and resources.
At the same time, you have to manage expectations. Business stakeholders may not fully grasp the iterative, sometimes circular, nature of data science. This can lead to pressure for quick, definitive results. This is where clear communication and structured planning become your best friends. For a deep dive into structuring your projects for success, our guide on data science project management provides a proven framework for keeping everyone on the same page.
A common point of failure isn't the algorithm, but the communication gap between the data team and business leaders. Bridging this gap is a critical, non-technical skill for every data scientist.
The Challenge of Explaining "Black Box" Models
Another major hurdle appears when it's time to explain your model's decisions. Highly complex models like deep neural networks or large ensemble methods can deliver incredible accuracy, but they often operate like a "black box." It’s tough to peek inside and understand why they made a particular prediction. For stakeholders, especially in regulated industries like finance or healthcare, this lack of transparency can be a complete deal-breaker.
Fortunately, the growing field of Explainable AI (XAI) gives us powerful tools to peer inside these complex models.
- SHAP (SHapley Additive exPlanations): This tool assigns an importance value to each feature for a single prediction. It shows you which factors pushed the model's decision one way or the other. For instance, it can show that a high
credit_scorewas the main reason a loan application was approved. - LIME (Local Interpretable Model-agnostic Explanations): LIME takes a different approach. It creates a simpler, interpretable model around a single prediction to explain it locally. It helps answer the question, "Why did the model make this specific decision for this one person?"
Practical Example: A bank uses a "black box" model to deny a loan. The applicant demands an explanation. Using SHAP, the loan officer can show the applicant a chart revealing that a low income_to_debt_ratio and a short_credit_history were the two biggest factors behind the denial. This turns a frustrating "computer says no" moment into an actionable conversation about what the applicant needs to improve.
Frequently Asked Questions

As you get more familiar with the data science lifecycle, a few common questions tend to pop up. Let's clear up some of the most frequent ones to give you a better handle on how this all works in practice.
Is the Data Science Lifecycle Always a Linear Process?
Not at all. In fact, thinking of it as a straight line is one of the biggest misconceptions. The lifecycle is highly iterative, with teams constantly circling back to earlier stages as they uncover new insights.
It's better to picture it as a loop with built-in feedback mechanisms. Each stage feeds information back into the others, creating a more robust and refined outcome.
Practical Example: Let's say your model evaluation (Stage 5) reveals it’s doing a poor job of predicting customer churn. This might signal that your data preparation (Stage 3) missed a crucial detail, like seasonal buying habits. Your team would then loop back to Stage 3 to re-engineer those features before trying the modeling stage again. This iterative nature isn't a flaw; it's the core strength of the process.
How Much Time Is Spent on Each Stage?
While every project has its own unique demands, there's a widely recognized rule of thumb in the data science community. A staggering 60-80% of the entire project timeline is often dedicated to data preparation and feature engineering.
The early stages, like defining the business problem and exploring the data, might take up 10-15% of the time. Modeling, evaluation, and deployment then share the rest. As our guide on data preprocessing highlights, all that intensive cleanup work is the non-negotiable foundation for any trustworthy model.
What Are the Most Important Tools to Know?
The right tool for the job really depends on where you are in the lifecycle. Instead of trying to learn everything at once, it's smarter to focus on a few core tools for each specific phase.
Here’s a solid starting point:
- Data Preparation: Python, especially with libraries like Pandas and NumPy, and SQL are the absolute essentials for cleaning and shaping data.
- Modeling: For building machine learning models, industry standards include Scikit-learn, TensorFlow, and PyTorch.
- Deployment & MLOps: To get your models into the real world, you'll need familiarity with cloud platforms like AWS, Azure, or GCP. Containerization tools like Docker are also becoming indispensable.
Can I Skip a Stage in the Lifecycle?
Tempting as it might be, skipping a stage is one of the fastest routes to project failure. It's highly discouraged because each step builds directly on the one before it. There’s a logical dependency that ensures the final result is sound.
Actionable Insight: Think about it this way—if you skip the business understanding stage, you risk solving the wrong problem entirely. If you neglect data preparation, you’re setting yourself up for a "garbage in, garbage out" disaster. And if you bypass evaluation, you’re flying blind, deploying a model without any idea if it actually works. Sticking to the process is your best bet for delivering a valuable, reliable solution.
At DATA-NIZANT, we demystify complex topics in data science and AI. Our expert-authored articles provide the actionable intelligence you need to master the entire data science lifecycle and drive real-world impact. Explore more insights at https://www.datanizant.com.

