
An automated data pipeline is really just a system that moves data from point A to point B on its own. Think of it like a fully automated factory designed for your company’s information. Raw materials—like data from your apps, CRM, and various sensors—are fed into an intelligent assembly line. Along the way, they’re processed and refined into something genuinely valuable: actionable business insights. And the best part? It all happens without anyone lifting a finger.
The Modern Data Factory Explained
Let’s be real: your business runs on information, but that information is probably scattered all over the place. You have sales data sitting in your CRM, user activity tracked in your mobile app, and marketing results spread across a dozen different ad platforms. Trying to manually collect, clean, and stitch all that data together is a nightmare. It’s slow, it’s expensive, and it’s a breeding ground for human error.
This is exactly the headache that automated data pipelines were created to solve.
They function as the central nervous system for any data-driven organization, guaranteeing a constant and reliable flow of information. By automating this entire process, companies can ditch the tedious manual work, slash the risk of costly errors, and give their teams access to fresh, trustworthy data for making critical decisions. This isn’t just about operational efficiency; it’s a strategic move that directly fuels growth and makes a business far more agile.
The market has certainly taken notice. The global automated data pipeline market was valued at around $10.01 billion in 2024. It’s projected to explode to an estimated $43.61 billion by 2032, which represents a massive compound annual growth rate of 19.9%. This incredible growth shows just how indispensable these systems have become. You can dig deeper into these numbers in the full market analysis on Fortune Business Insights.
Core Components of the Data Factory
To really get a feel for how these pipelines work, it helps to break them down into their core stages. Each stage has a specific job to do, much like different stations on a factory’s assembly line.
The diagram below illustrates the three fundamental stages you’ll find in almost any automated data pipeline.
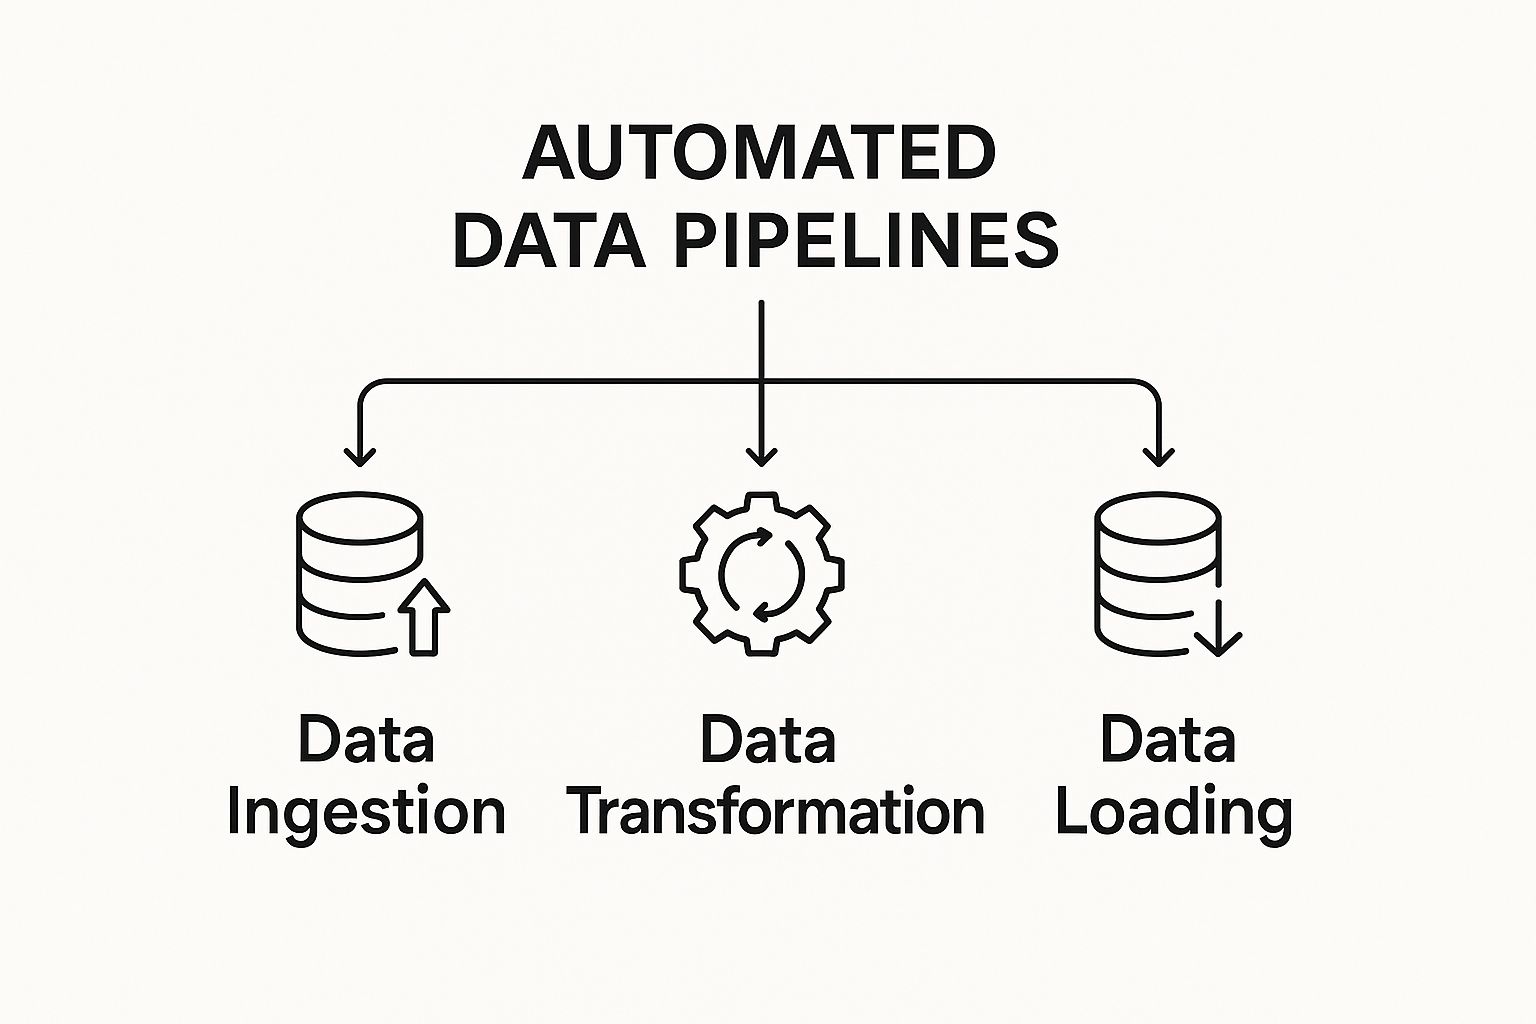
This visual really simplifies the pipeline into its essential building blocks, showing how data journeys from a raw, messy state into a clean, usable format.
These stages work in perfect harmony to create a seamless flow of information. If any single one of them fails, the entire pipeline grinds to a halt, and the systems and people who rely on that data are left in the dark.
Let’s take a closer look at what each component does, using our data factory analogy to make it stick.
Core Components of an Automated Data Pipeline
Here’s a breakdown of the essential stages within a typical automated data pipeline. Each one plays a crucial role in turning raw data into real business insights.
| Component | Function | Example Analogy (Data Factory) |
|---|---|---|
| Data Ingestion | This is the process of pulling or receiving raw data from all your different sources, like APIs, databases, or IoT sensors. | Think of this as raw materials—wood, metal, plastic—arriving at the factory’s receiving dock from various suppliers. |
| Data Transformation | Here, the data is cleaned up, validated, enriched, and restructured into a consistent, usable format. | This is the assembly line itself, where the raw materials are cut, shaped, painted, and put together to create finished parts. |
| Data Loading | Finally, the processed data is delivered to its destination, which could be a data warehouse, an analytics tool, or another application. | The finished products are now packaged, labeled, and shipped from the warehouse directly to the retail stores that need them. |
At the end of the day, an automated data pipeline isn’t just a piece of technology; it’s a powerful business asset. It takes the chaotic noise of raw data and turns it into a clear, strong signal, allowing your entire organization to operate with greater precision and intelligence.
Choosing Your Pipeline Architecture

So, you’ve decided to build a data pipeline. One of the first and most critical forks in the road is choosing its fundamental structure, or architecture. This isn’t just a technical detail; it’s a strategic decision that shapes how your data moves, what it costs, and how quickly you can get answers from it.
Think of it like deciding how to ship goods. If you’re moving bulk commodities overseas, a massive, consolidated cargo shipment makes perfect sense. It’s cost-effective, but not fast. On the other hand, if you’re delivering a time-sensitive organ for transplant, you need an immediate, direct courier. Both get the job done, but they serve completely different needs.
The same logic applies to your data. The three dominant architectures today are ETL, ELT, and real-time streaming. Let’s break down what they are and when you’d pick one over the others.
The Classic Approach: ETL (Extract, Transform, Load)
The old guard of the data world is ETL. For decades, this was the way to do things. The process is right there in the name:
- Extract: Pull data from your various sources—databases, CRMs, you name it.
- Transform: Move that raw data to a separate staging server where all the messy work happens. Here, it’s cleaned up, standardized, and molded into a pristine, structured format.
- Load: Finally, load the polished, analysis-ready data into its destination, usually a data warehouse.
This “transform first, ask questions later” approach came from an era when storage and compute power were incredibly expensive. It was far more economical to do all the heavy processing upfront and only store the perfectly finished product in the pricey data warehouse.
When to Use ETL: This method is still the gold standard for situations demanding high precision and compliance. Think of a financial services company preparing data for regulatory reports. Every piece of information must be validated and standardized before it ever touches the official reporting system. ETL provides that control.
The Modern Cloud-Native Model: ELT (Extract, Load, Transform)
Then, the cloud changed everything. With the arrival of hyper-powerful and relatively cheap cloud data warehouses like Snowflake and Google BigQuery, a new, more flexible model took over: ELT.
ELT simply flips the last two steps. You extract the raw data and immediately Load it into the warehouse. All the Transformation happens right there, inside the warehouse, using its massive parallel processing power.
This is a game-changer. It gives data scientists and analysts access to the raw, untouched data, allowing them to shape and reshape it for countless different use cases without having to go back to the source. It’s all about flexibility.
When to Use ELT: ELT is perfect for businesses that need to move fast and empower their analytics teams. An e-commerce brand can dump raw clickstream data, sales figures, and inventory logs into its cloud warehouse. The marketing team can then transform a copy for attribution models, while the operations team transforms another for supply chain forecasts—all from the same raw source.
The Need for Speed: Real-Time Streaming
Both ETL and ELT typically run in batches—maybe once a day or once an hour. But what happens when “an hour ago” is already too late? That’s where real-time streaming comes in.
Instead of collecting data into big chunks, streaming pipelines process it continuously, event by event, often within milliseconds of it being created. This isn’t about loading batches; it’s about handling a constant, never-ending flow of information.
This is the architecture of immediate action. It’s what powers fraud detection systems that need to block a transaction right now or live dashboards monitoring factory production lines.
When to Use Streaming: Imagine a logistics company tracking its delivery fleet. GPS data pings from trucks in real-time, feeding a streaming pipeline. This allows the operations team to see exactly where every truck is, re-route them around sudden traffic, and give customers hyper-accurate arrival times. The value of that GPS ping drops with every passing second, making streaming the only viable option.
Ultimately, choosing between these architectures is a trade-off. You’re balancing speed, cost, flexibility, and the complexity of the build. The right answer isn’t about which is “best,” but which is best for your business goals and the questions you need your data to answer.
The Modern Toolkit for Building Pipelines

An automated data pipeline isn’t a single piece of software. It’s a carefully assembled collection of specialized tools, each tackling a specific part of the job. This ecosystem is what we call the modern data stack.
Think of it like a master chef’s kitchen. You wouldn’t use a single, all-purpose knife for every task. You have a cleaver for heavy chopping, a paring knife for delicate work, and a serrated knife for bread. Each one is the best at what it does. Similarly, a robust pipeline uses the right tool for each stage of the data’s journey, creating a system that’s both powerful and efficient.
Let’s open the toolbox and see what’s inside.
Data Ingestion and Integration Tools
First things first: you have to get the data. Data ingestion tools are the workhorses that handle this critical first step. They specialize in connecting to hundreds of different sources—from SaaS platforms like Salesforce and HubSpot to databases like PostgreSQL—and pulling data out reliably.
Their job is to automate the “Extract” and “Load” stages. Instead of having engineers write and maintain fragile custom scripts for every API, these platforms provide pre-built connectors that simply work.
- Example Tool: Fivetran is a popular choice that automates data movement from source systems into your data warehouse with surprisingly little setup.
- Key Function: These tools manage the messy details like API authentication, rate limits, and schema changes, ensuring data flows consistently without anyone needing to intervene manually.
Data Transformation Engines
Once the raw data lands in your warehouse, it’s rarely ready for analysis. It needs to be cleaned up, organized, and joined with other datasets to create a single source of truth. This is where data transformation tools shine.
These platforms let analysts and engineers use their business logic to turn raw, messy tables into clean, reliable datasets perfect for reporting and analytics.
The rise of powerful transformation tools marks a huge shift in the industry. It empowers analytics professionals to model data directly with SQL—a language they already know inside and out—instead of waiting on separate software engineering teams. This dramatically speeds everything up.
A leader in this space is dbt (data build tool), which lets teams transform data right inside their warehouse using plain SQL. Better yet, it brings software engineering best practices like version control, testing, and documentation into the analytics workflow.
The Central Hub: Cloud Data Warehouses
The centerpiece of the entire modern stack is the cloud data warehouse. This is the powerful, scalable destination where all your data is stored and where most of the transformation and analysis actually happens.
Platforms like Snowflake, Google BigQuery, and Amazon Redshift offer what feels like limitless storage and compute power, and you only pay for what you use. Their architecture is the magic that makes modern ELT (Extract, Load, Transform) pipelines possible, as they can easily handle the heavy lifting of transforming enormous amounts of raw data.
Orchestration and Observability
With data moving between all these different tools, you need a conductor to make sure every part of the symphony plays at the right time and in the right order. Workflow orchestration tools manage the entire pipeline, kicking off ingestion jobs, running transformations once new data arrives, and alerting the team if anything breaks.
- Example Tool: Apache Airflow is a widely used open-source orchestrator that lets you define complex data workflows as code.
Finally, data observability platforms act as the pipeline’s alarm system. They monitor the health of your data, alerting you to problems like stale data, weird volume spikes, or unexpected schema changes. This kind of proactive monitoring is absolutely essential for building trust in your automated systems.
The demand for these tools is exploding as more businesses realize how vital they are. The data pipeline tools market was valued at around $11.24 billion in 2024 and is expected to hit $13.68 billion by 2025, growing at an incredible 21.8% annually. This growth is driven by the need for business agility and the boom in machine learning. You can explore the full analysis of the data pipeline tools market to see exactly how these trends are shaping the industry.
Sure, here is the rewritten section, crafted to sound like it was written by an experienced human expert.
What’s the Real Payoff? Unlocking Key Business Benefits
Let’s move past the technical nuts and bolts. While the architecture is fascinating, the true power of automated data pipelines is what they do for the business. This isn’t just an IT upgrade; it’s a strategic move that directly translates to better efficiency, smarter decisions, and a stronger competitive edge.
Think about a typical retail company stuck in the old ways. Their marketing team pulls sales reports once a week, so every campaign is based on last week’s news. By the time they spot a trend, the opportunity is already gone. This kind of reactive, sluggish decision-making is a classic symptom of manual data wrangling.
From Manual Drudgery to Strategic Advantage
Now, imagine that same company flips the switch on an automated data pipeline. Sales data from their point-of-sale systems, website, and mobile app flows into their data warehouse almost instantly. Analysts are no longer drowning in spreadsheets, copying and pasting data for hours on end. Instead, they’re building dashboards that show what’s happening right now.
This shift creates a clear and immediate impact. It really boils down to three game-changing benefits:
- You can finally trust your data. Automation all but eliminates human error. Manual data entry is a minefield of typos, formatting errors, and copy-paste mistakes that poison your insights. A well-built pipeline runs the same validated logic every single time, guaranteeing that the data hitting your dashboards is clean, consistent, and reliable.
- Decisions get made in hours, not weeks. With a constant stream of fresh, reliable data, you can stop looking in the rearview mirror. Instead of basing strategy on last month’s numbers, your teams can respond to market changes and customer behavior in near real-time. That speed is a massive advantage.
- Your best people can do their best work. Pulling your skilled (and expensive) data engineers and analysts off tedious data prep is a huge productivity win. Automation handles the grunt work, freeing them to focus on what they were hired for: advanced analytics, building predictive models, and uncovering the strategic insights that actually move the needle.
Manual vs. Automated Data Pipelines: A Comparative Analysis
To really drive home the difference, let’s put the two approaches side-by-side. The contrast between a manual process and an automated one is stark, touching everything from team morale to the company’s bottom line.
| Aspect | Manual Data Process | Automated Data Pipeline |
|---|---|---|
| Data Freshness | Stale; updated weekly or monthly | Near real-time; updated in minutes or hours |
| Reliability | Prone to human error, typos, and inconsistencies | Highly consistent and reliable; logic is validated once |
| Team Focus | Data wrangling, copying/pasting, and fixing errors | Analysis, strategic insights, and predictive modeling |
| Decision Speed | Reactive; decisions based on outdated information | Proactive; ability to respond to live market changes |
| Scalability | Poor; adding new sources is a major project | High; designed to handle growing data volumes |
| Cost | High hidden costs in labor and missed opportunities | Upfront investment with high long-term ROI |
The table makes it clear: clinging to manual processes means you’re constantly playing catch-up, working with questionable data, and misallocating your most valuable talent.
The Real-World Impact on Your Operations
These benefits aren’t just theoretical; they ripple across the entire organization. Around the world, automated data pipelines have become fundamental to how modern companies operate. The growing need for real-time analytics and tighter security has made security data pipelines a major area of growth, helping companies cut costs and improve threat detection.
By automating the flow of information, you’re not just moving data—you’re building a smarter, more agile, and more data-fluent organization from the ground up. The result is a business that learns faster and executes with more precision.
This is especially critical when pipelines are feeding complex systems like machine learning models. The performance of these models depends entirely on the quality and timeliness of the data they receive. Managing the data that trains and retrains these models is a crucial discipline. If you’re interested in that side of things, our guide on AI model management shows just how foundational good data pipelines are for any successful AI initiative.
At the end of the day, the argument for building an automated data pipeline is a business one. It’s about giving your teams information they can trust, helping you move faster than your competition, and enabling smarter decisions at every level of the company.
Automated Data Pipelines in Action

Theory is one thing, but seeing automated data pipelines at work is what really drives the point home. These systems aren’t just abstract concepts for tech giants; they are practical tools solving real, everyday business problems across just about every industry you can think of.
To make these ideas more concrete, let’s walk through two distinct scenarios. These examples show how a well-designed pipeline can shift a company from just reacting to problems to proactively shaping its strategy with data.
Marketing: Finally Achieving a True Customer 360 View
Imagine a fast-growing e-commerce company. Their marketing team was wrestling with a classic headache: their customer data was all over the place. They knew they had valuable information, but it was trapped in different platforms that didn’t speak to each other.
- Salesforce held all the lead and conversion history.
- Google Ads had the campaign performance and cost data.
- Their mobile app database tracked every user tap and interaction.
The team was stuck trying to answer critical questions like, “Which ad campaigns are actually bringing in our most profitable long-term customers?” Getting an answer meant manually exporting CSV files from all three systems and then spending days trying to stitch them together in spreadsheets. The whole process was slow, riddled with errors, and by the time they had an answer, it was already out of date.
The Solution: They built an automated data pipeline. A data integration tool was set up to automatically pull data from the Salesforce and Google Ads APIs while also connecting directly to the app’s database. Every hour, this pipeline funneled fresh data into a central data warehouse.
From there, a transformation tool ran scheduled jobs to clean everything up, standardize fields like customer IDs, and join the separate datasets. The outcome? A single, unified view of each customer, tracing their entire journey from the first ad click to their latest in-app purchase. This pipeline fed directly into a real-time analytics dashboard, giving the team that elusive 360-degree customer view.
Manufacturing: Preventing Costly Failures with Predictive Maintenance
Now, let’s switch gears to a heavy industry setting. Picture a large manufacturing firm with a factory floor full of complex, expensive machinery. An unexpected equipment failure could shut down a production line for hours, costing tens of thousands of dollars in downtime and lost output.
The factory was already outfitted with hundreds of IoT (Internet of Things) sensors on its machines, measuring things like temperature, vibration, and pressure in real-time. The problem was, this massive stream of data was mostly being ignored. Maintenance was purely reactive—a machine was only fixed after it broke down.
The Solution: The firm implemented a real-time streaming pipeline. This pipeline was designed to ingest the constant flow of sensor data the moment it was generated. The data streamed directly into a system capable of running machine learning models in real-time.
Data scientists developed a predictive maintenance model, training it on historical failure data. The live pipeline fed sensor readings into this model, which constantly scanned for the subtle patterns that signaled a machine was likely to fail soon.
When the model detected an anomaly, the pipeline would automatically trigger an alert to the maintenance team, pointing out the specific machine and component that needed attention. This allowed technicians to perform targeted, proactive maintenance, swapping out parts before they could cause a catastrophic failure. The impact on the business was immediate and substantial, dramatically cutting down on unplanned downtime.
Of course, building powerful systems like these isn’t always straightforward. You can learn more about the common hurdles teams face by reading our detailed article on data integration challenges.
Best Practices for Building Robust Pipelines
Getting your first automated data pipeline up and running is a huge accomplishment. But here’s the real challenge: it’s not just about making it work once, but about making it last. A pipeline that’s brittle, hard to understand, or a nightmare to change will quickly become a liability instead of the asset you intended it to be.
To dodge the common traps and build something truly enterprise-grade, you need discipline from day one. Following a few battle-tested best practices will ensure your pipelines are scalable, reliable, and efficient for the long haul.
Prioritize Data Quality and Testing
The most common reason data projects fail isn’t a complex bug or a server crash—it’s the data itself. If your stakeholders can’t trust the numbers, the entire system is worthless. This is precisely why data quality can’t be an afterthought.
A pipeline that delivers bad data faster isn’t an improvement; it’s just a way to make bad decisions with more confidence. The real goal is to build unwavering trust in the data you provide.
You have to embed data quality checks directly into your workflows. These tests should run automatically at critical stages, looking for things like null values, unexpected formats, or data that falls way outside a normal range. Modern tools like dbt (data build tool) make it surprisingly simple to write and automate these checks as a natural part of your transformation code.
- Freshness Checks: Is the data stale? Verify its last update time to make sure it’s recent.
- Uniqueness Tests: Confirm that primary keys in a table are, in fact, unique, with no duplicates.
- Volume Tests: Set up alerts for when the number of incoming rows suddenly spikes or plummets—a classic sign of an upstream problem.
Build for Scalability and Modularity
Your data needs are going to grow. It’s inevitable. A pipeline built for a single use case today might need to power ten more next year. To manage this growth without constant, painful rewrites, you need to build with modular, reusable components from the start.
Instead of creating one giant, monolithic script that does everything, break your pipeline into smaller, logical stages. Think of it like building with LEGOs. You might have one block for ingesting raw data, separate blocks for cleaning and standardizing different sources, and a final one for creating business-level views.
This approach makes your automated data pipelines far easier to manage, test, and update. When you need to change how customer data is processed, you can swap out just one component without putting the entire system at risk.
Implement Proactive Monitoring and Alerting
One of the most dangerous things in a data pipeline is a silent failure. You absolutely need to know the moment something breaks—not hours or days later when a business user reports that their dashboard looks “weird.”
This is where proactive monitoring and alerting come into play. Set up automated systems to keep a constant watch over your pipeline’s health. Your team should get an immediate notification via Slack, email, or a paging service if a job fails, a data quality test flags an issue, or a process takes unusually long to run.
Effective monitoring also has a direct impact on your bottom line. By tracking resource usage, you can spot inefficient queries or over-provisioned infrastructure that are needlessly driving up costs. For a deeper look at managing these expenses, our complete guide to cloud cost optimization offers invaluable strategies to keep your data operations both effective and affordable.
Common Questions About Data Pipelines
When your team starts digging into automated data pipelines, a few questions always pop up. It’s totally normal. Getting straight answers to these practical concerns is key to moving forward without second-guessing every decision.
Let’s cut through the noise and tackle the most common queries. The goal isn’t to get lost in a technical rabbit hole, but to give you the confidence to make smart choices for your first project.
ETL or ELT for a First Project?
This is easily one of the first big questions. Should you go with the traditional ETL (Extract, Transform, Load) model or the more modern ELT (Extract, Load, Transform) approach?
For most teams just getting started today, ELT is the more strategic starting point.
Why? Because ELT plays perfectly to the strengths of today’s powerful cloud data warehouses. You load raw, untouched data directly into your warehouse, which gives your team incredible flexibility. Analysts can then experiment, build different models, and explore the data for all sorts of use cases without ever needing to go back and rebuild the initial ingestion process. ETL still has its place, especially in highly regulated industries where data absolutely must be sanitized before it even touches a system, but ELT offers far more agility for most first-time projects.
First Steps to Building a Pipeline
The idea of building your first pipeline can feel massive, but it doesn’t have to be. The best way to begin is by thinking small and logically, like a focused pilot project.
- Identify a High-Value Use Case: Don’t just build a pipeline for the sake of it. Start with a real business problem. What question, if you could answer it with data, would make a tangible impact? Maybe it’s figuring out customer churn drivers or finally getting a clear picture of marketing spend ROI.
- Pinpoint Your Data Sources: Where is the data you need to answer that question? Start by identifying just 1-3 essential sources. This could be your CRM, a Google Ads account, or a production database.
- Select Core Tools: Choose a simple, modern data stack. A typical setup includes a data integration tool to pull the data, a cloud data warehouse (like Snowflake or BigQuery) to store it, and a transformation tool (like dbt) to model it.
The secret is to start small. Seriously. Don’t try to boil the ocean by connecting every single data source from day one. Prove the concept and deliver value with a single, well-defined pipeline first. You can always expand from there.
Required Skillset for Maintenance
Another frequent concern revolves around who will actually keep these pipelines running. Do you need a team of highly specialized data engineers?
While building complex, custom-coded pipelines from the ground up does require deep engineering expertise, maintaining pipelines built with modern tools is a whole different story. It’s significantly more accessible.
Many of today’s no-code or low-code data integration platforms handle the heavy lifting—the infrastructure, the scheduling, the error handling—behind the scenes. This frees up your team so that day-to-day maintenance often falls to data analysts who are already comfortable with SQL. They can manage the business logic in the transformation layer and troubleshoot most issues without needing to be software engineers. This dramatically lowers the barrier to entry.
Supporting Data Privacy and Compliance
Finally, how do automated pipelines help with complex regulations like GDPR or CCPA? It turns out they are actually a cornerstone of good data governance.
Pipelines create a centralized, auditable trail for all data movement. Instead of data being manually pulled and pushed from a dozen different places, you have one controlled flow. You can build rules directly into your transformation logic to automatically anonymize, mask, or delete personally identifiable information (PII). This ensures compliance is baked into the system, rather than being an afterthought that relies on manual checklists and human memory.
Ready to build a data-driven culture that scales? At DATA-NIZANT, we provide the expert insights and analysis you need to master complex topics in AI, data science, and cloud infrastructure. Explore our in-depth articles to stay ahead of the curve. https://www.datanizant.com

