
A data science project is much more than just crunching numbers. It's a structured journey that starts with a business problem and ends with a tangible solution—often a model or analysis that delivers real value. The whole point is to move from raw, messy data to insights you can actually act on.
Defining a Problem Worth Solving
This might sound counterintuitive, but the most crucial part of any data science project happens long before you write a single line of code. It’s right here, at the problem definition stage, where projects are set up for success or doomed to fail. A project with a fuzzy objective is a project going nowhere.
We've all heard vague goals like, "Let's use AI to improve sales" or "We need to predict customer churn." These are aspirations, not plans. They're too broad to guide your work or measure your impact. The real skill is turning these high-level ideas into sharp, measurable, and answerable questions that lead to actionable insight.
From Vague Goals to Specific Questions
Your first job is to sit down with the business stakeholders—the people who actually feel the pain your project is meant to solve. Think of yourself as a translator, converting their business needs into a technical problem statement. This means asking the right questions to get to the heart of the matter.
Let's take the classic "predict customer churn" example. Don't stop there. Dig deeper to make it actionable:
- Who are we most worried about losing? (Probably high-value customers, not everyone.)
- When do we need to know they might leave? (To be useful, we need a heads-up, say, 30 days before their renewal date.)
- What will we actually do with this prediction? (The goal is to target them with a personalized retention offer.)
Suddenly, a vague wish becomes a focused, powerful problem: "Identify high-value customers who are likely to churn 30 days before their renewal so we can proactively send them a personalized retention offer." Now you have clear direction and a direct link to business value.
A well-defined problem statement is like a contract between the data science team and the stakeholders. It locks in expectations, defines the project's scope, and gives everyone a clear benchmark for success.
The initial flow of a project, as shown below, always starts with nailing down this problem definition.
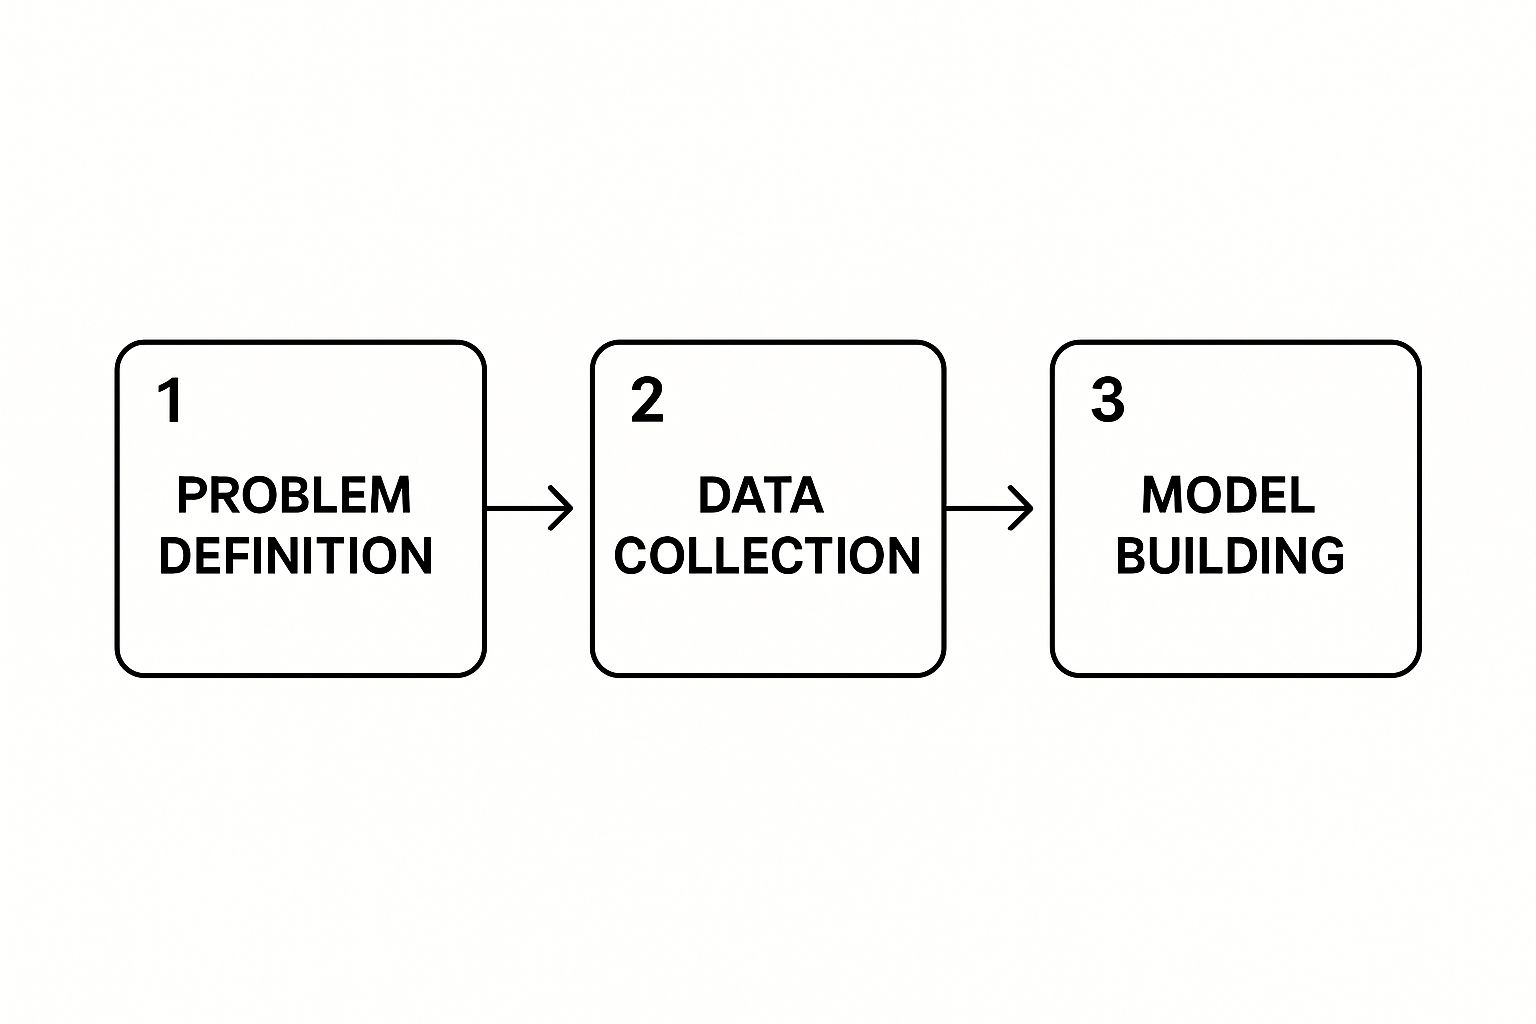
This visual really drives home that defining the problem isn't just a formality—it's the foundation that dictates everything that follows, from the data you collect to the models you build.
Before you start a project, it helps to formalize this process. I've found that using a simple framework keeps everyone aligned and ensures all the key questions are answered upfront.
Data Science Project Scoping Framework
| Component | Description | Practical Example (Customer Churn) |
|---|---|---|
| Business Objective | The high-level goal the business wants to achieve. | Reduce the churn rate of our most valuable customers. |
| Problem Statement | The specific, data-driven question to be answered. | Can we predict which high-value customers will churn 30 days before renewal? |
| Success Metrics (KPIs) | How we'll measure the project's business impact. | – Reduce churn in the target group by 15%. – Achieve a 3x ROI on the retention campaign. |
| Data Requirements | What data is needed to solve the problem. | Customer demographics, purchase history, support ticket data, website activity. |
| Constraints & Risks | Potential blockers or limitations. | – Data privacy (GDPR/CCPA). – Limited historical data for new customer segments. – Model must be interpretable. |
| Deliverable | The final output of the project. | A deployed API that returns a daily list of at-risk customers. |
This framework isn't just a planning tool; it's a communication tool. It ensures that both the technical team and the business stakeholders are speaking the same language from day one.
Establishing Clear Success Metrics
Once the problem is clear, you need to define how you'll measure success. This isn't just about model accuracy; it's about business impact. Your Key Performance Indicators (KPIs) should tie directly back to the problem you’re solving.
For our churn example, relevant KPIs might be:
- The number of high-value customers correctly identified as at-risk.
- The percentage reduction in the churn rate for the group we targeted.
- The Return on Investment (ROI) of the retention campaign.
Setting meaningful KPIs requires a good handle on foundational concepts. If you feel a bit rusty, our guide on basic statistics concepts is a great refresher to make sure your metrics are solid.
The investment in this kind of work is massive. The global data science platform market was valued at USD 204.58 billion in 2024 and is on track to hit an incredible USD 1,568.85 billion by 2032. This explosive growth shows just how vital these projects are, especially in sectors like finance, which lean heavily on data science for everything from fraud detection to risk assessment.
Sourcing and Preparing Your Data

Now that you've pinned down the problem, it's time to get your hands on the raw materials for your data science project. High-quality data is the lifeblood of any model, but it rarely shows up clean and ready to go. Think of this phase as a two-part journey: first, you'll acquire the data, and then you'll meticulously clean and explore it.
Getting your data can mean anything from querying internal company databases and tapping into third-party APIs to grabbing public datasets from platforms like Kaggle or Google Dataset Search. Before you dive in, pause and think about the ethics and legal rules. You absolutely must have the right permissions and comply with regulations like GDPR or CCPA, especially if you're handling personally identifiable information (PII).
With data in hand, the real work begins. Real-world data is a mess. It's almost always filled with issues that can quietly poison your model if you don't find and fix them first.
The Reality of Data Cleaning
Data preparation isn't the most glamorous part of the job, but it's where countless projects succeed or fail. In fact, it's not uncommon for data scientists to spend up to 80% of their time on this step alone. You'll be spending a lot of time with tools like the Pandas library in Python to systematically hunt down and fix data quality problems.
Practical Example: Customer Churn Data
Let’s go back to our customer churn project. Imagine you've pulled data from three different places into a single table:
- Customer Info: From your company's CRM.
- Usage Data: From application logs.
- Support Tickets: From your helpdesk system.
The moment you merge them, you'll start seeing problems pop up that require actionable solutions:
- Missing Values: Your
Last_Login_Datecolumn might be empty for customers who signed up but never logged in. Deleting these rows is a bad idea—you'd lose valuable information. Instead, a practical action is to impute a sensible value, like their sign-up date, to show they haven't been active. - Inconsistent Formats: In the
Subscription_Plancolumn, you might find "premium," "Premium," and "prem_plan." To your model, these are three different things. You need to standardize them to a single format, like "Premium," so they're treated as one category. - Outliers: You spot a customer with 5,000 support tickets, but the average is only 3. Is this a typo, or a genuinely high-maintenance account? You have to investigate. Your action could be to cap the value, remove the record, or treat it as a special case.
Data cleaning isn't just janitorial work. It's your first real conversation with your dataset. Every missing value or strange outlier tells a story, and these stories often hide surprising insights about the very problem you’re trying to solve.
The entire flow—from source to cleaned data ready for a model—is a complex pipeline. Keeping it healthy is vital. It's worth learning about the best data pipeline monitoring tools to ensure your data stays reliable as your project evolves.
Uncovering Insights with Exploratory Data Analysis
Once your data is clean, you can finally start the fun part: Exploratory Data Analysis (EDA). This isn't about ticking boxes on a checklist; it's a creative, investigative process. The goal here is to build an intuition for your data, challenge your initial assumptions, and uncover hidden patterns that will shape your modeling strategy.
Using visualization libraries like Matplotlib and Seaborn, you can start asking questions. For our churn example, you could create visuals to investigate and generate actionable insights:
- Histograms: What does the distribution of customer tenure look like? A histogram might reveal that most churned customers leave within their first six months, leading to an action: improve the onboarding experience.
- Bar Charts: Is there a big difference in churn rates across subscription plans? A simple chart might shout that your "Basic" plan has a 40% churn rate, while the "Enterprise" plan is only at 5%. This is a direct signal to re-evaluate the value proposition of the Basic plan.
- Scatter Plots: Is there a connection between how many support tickets a customer files and how many days they were active last month? This could reveal if poor service experiences lead to disengagement, providing a clear mandate to improve support quality.
This is the detective work that separates a good data science project from a great one. The patterns you spot during EDA become the foundation for your feature engineering and modeling choices. It’s how you turn raw, messy data into a compelling story about customer behavior.
Feature Engineering and Model Building
This is where the magic really starts to happen in a data science project. Once your data is sourced and squeaky clean, you get to the fun part: transforming raw information into something with real predictive muscle. This is a two-step dance of creative feature engineering and strategic model building.
I've always said that feature engineering is more art than science. It's the process where you lean on your domain knowledge to invent new features from the raw variables you have. These handcrafted features are what can take a machine learning model from just okay to truly outstanding.
Crafting Impactful Features
You can't just dump raw data columns into a model and hope for the best—it rarely works. The real goal is to create features that send clear, meaningful signals to your algorithm. This is where your deep understanding of the business problem gives you a massive edge.
Let's jump back to our customer churn project. Instead of just using a raw last_login_timestamp, you can engineer much more potent features. Think about what truly signals a customer is losing interest. A practical example of creating actionable features:
days_since_last_login: This is far more intuitive for a model to understand. A high number is a direct signal of disengagement and a strong predictor of churn.login_frequency_last_30_days: This feature captures recent behavior trends. A sudden nosedive in login frequency could be a major red flag.support_interaction_to_usage_ratio: Simply counting support tickets can be misleading. A better feature is the ratio of tickets to login days. A high ratio is a powerful indicator of frustration.
These aren't features you just find in the data; you create them based on your hypotheses about what drives churn. It's a pivotal stage that bridges the gap between raw data and a working model. For a broader look at how this fits into the overall process, our guide on mastering the data science lifecycle offers more practical insights.
Feature engineering is your chance to inject human intelligence into the machine learning process. It’s how you tell the model what's important, guiding it toward the patterns that matter most for your specific business problem.
The amount of data we have to work with is mind-boggling. Projections show the global data volume will hit an incredible 175 zettabytes by 2025. This explosion, fueled by IoT and our digital lives, demands advanced projects that can make sense of it all. It’s no surprise the machine learning and AI markets are booming, expected to reach $96.7 billion and $190.61 billion by 2025, respectively.
Choosing Your Model and Establishing a Baseline
With your powerful new features in hand, it's time to pick an algorithm. The right choice depends entirely on your project's goal. For a classification task like predicting churn (a "yes" or "no" outcome), you have plenty of great options.
A common rookie mistake is to immediately reach for the most complex, sophisticated algorithm. My advice? Start simple.
- Establish a Baseline: Kick things off with a straightforward, interpretable model like Logistic Regression. It's quick to train and its results are easy to explain to stakeholders. This model becomes your baseline—any fancier model you try has to beat this one to be worthwhile.
- Define Your Metric: Pick a performance metric that actually aligns with your business objective. Accuracy is common, but it can be really misleading for churn prediction, where you usually have far more non-churners than churners. Metrics like F1-score (which balances precision and recall) or AUC (Area Under the Curve) are often much better choices.
- Iterate and Test: After setting a baseline, you can start experimenting with more powerful models like Random Forests or Gradient Boosting Machines (like XGBoost). These can uncover more complex, non-linear patterns in your data, but they also take more computational power and are tougher to interpret.
The Critical Importance of Splitting Your Data
If there's one golden rule in model building, it's this: never, ever test your model on the same data it was trained on. If you do, you'll get a wildly optimistic and completely useless measure of its performance. To build a robust model that actually works on new, unseen data, you must split your dataset properly.
The standard, battle-tested approach is a three-way split:
- Training Set (e.g., 70% of data): This is the largest chunk of your data. The model learns all the underlying patterns from this set.
- Validation Set (e.g., 15% of data): You use this set to tune your model's hyperparameters (like the number of trees in a Random Forest) and to compare different models. You'll iterate and experiment using this data.
- Test Set (e.g., 15% of data): This dataset is the final, impartial judge. You must keep it locked away and only touch it once at the very end of your project to evaluate your final, chosen model. This gives you a realistic estimate of how it will perform in the real world.
This disciplined separation is your best defense against overfitting—a classic pitfall where your model memorizes the training data, noise and all, but fails to generalize to new information. Proper data splitting is what ensures your data science project delivers a reliable and trustworthy solution.
Evaluating and Interpreting Your Model
So you've built your model. You run it on your test data, see a 95% accuracy score, and it feels like time to celebrate. Hold on a second. In any serious data science project, that single accuracy number is almost never the full story. In fact, it can be dangerously misleading, especially when your data is imbalanced—a super common scenario in the real world.
A model is only useful if it's both effective and trustworthy. This means we have to dig deeper into its performance and, just as crucially, make its logic understandable to the people who will actually use its output.
Moving Beyond Simple Accuracy
Let's go back to our customer churn project. Imagine that only 5% of your customers churn each month. A lazy model could just predict that no one will churn and still hit 95% accuracy. While technically correct, that model is completely useless for the business. This is exactly why we need more nuanced metrics.
First, think about the business cost of being wrong in different ways to drive your choice of metric:
- False Positive: The model predicts a customer will churn, but they don't. You might send a retention offer to a perfectly happy customer. The cost is pretty minor.
- False Negative: The model predicts a customer will stay, but they actually churn. You lose that customer because you didn't see it coming. This is a major cost.
In this case, we care a lot more about catching potential churners, even if it means we incorrectly flag a few loyal customers along the way. This is where metrics like precision and recall come into play.
| Metric | Question it Answers | Relevance to Churn Project |
|---|---|---|
| Precision | Of all the customers we predicted would churn, how many actually did? | This tells you how many of your retention offers are being wasted. High precision means fewer wasted efforts. |
| Recall | Of all the customers who actually churned, how many did we successfully identify? | This is the make-or-break metric for us. High recall means you're catching most of the customers at risk of leaving. |
| F1-Score | What is the harmonic mean of precision and recall? | This gives you a single, balanced score. It’s a good go-to when both precision and recall are equally important. |
For our churn problem, the actionable insight is that we must optimize for high recall. We're willing to live with a bit of lower precision—sending a few unnecessary discounts—to make sure we don't miss customers who are about to walk out the door.
Making the Black Box Transparent
Even with stellar performance metrics, you'll find that business stakeholders are rightfully hesitant to trust a "black box" model. If a marketing manager is going to spend real budget money based on your model's predictions, they need to understand why it's making those calls. This is where interpretability becomes your best friend.
Trust is the currency of a successful data science project. If stakeholders don't understand and trust your model, it will never be fully adopted, no matter how accurate it is.
Thankfully, we have powerful techniques like SHAP (SHapley Additive exPlanations) and LIME (Local Interpretable Model-agnostic Explanations) designed for exactly this. They let us peek inside complex models and see which features had the biggest pull on any given prediction.
For instance, a practical application of SHAP could generate a clear visual showing that a specific at-risk customer was flagged because of three main reasons:
- A 75% drop in their login frequency.
- Opening three new support tickets in the last week.
- Their tenure is just under the 12-month mark, which you know is a common churn point.
Suddenly, a mysterious prediction becomes an actionable insight. The conversation shifts from "the model said so" to "the model flagged this customer because their behavior changed in these specific ways." This not only builds a bridge of trust but can also uncover patterns that inform broader business strategy.
Of course, tracking these drivers over time is a critical part of the long-term project lifecycle. To dig deeper into this, you can explore some comprehensive resources on machine learning model monitoring. By presenting your results with clear visuals and straightforward explanations, you transform your complex data science project into a compelling story that drives real business decisions.
Deploying Your Model and Driving Impact

Let's be honest. A perfectly tuned model sitting on your laptop is an academic achievement, not a business solution. The final, and arguably most critical, phase of any data science project is deployment. This is the moment of truth where you move your creation from a development environment into the real world to start generating actual value.
Deployment can sound intimidating, but it doesn't have to be. The right strategy depends entirely on your project's needs—you don't always have to build a complex, real-time system from scratch.
Choosing Your Deployment Strategy
The main goal here is simple: get your model's predictions into the hands of the people or systems that need them. The path you take can range from straightforward to highly sophisticated. A practical example helps illustrate the options:
- Batch Scoring: This is the simplest method by far. You run a script on a schedule—say, once a day—that scores a fresh batch of data and saves the predictions to a database. This is perfect for our churn project, where providing a daily list of at-risk customers to the marketing team is all that's required.
- Real-Time API: For applications that need instant predictions, you can wrap your model in an API using a lightweight web framework like Flask or FastAPI. A practical example would be a website showing a "customer at risk" flag to a sales agent while they are on a call with that customer.
- Embedded Model: For edge devices or mobile apps where constant internet connectivity isn't a guarantee, the model can be embedded directly into the application itself. This is a common approach for on-device ML, like a phone app that suggests photo edits.
The choice you make here directly dictates the architecture and resources you'll need. A simple batch job is far less maintenance than a high-availability API that has to serve thousands of requests per second.
A model in production is a living thing. It's not a 'fire and forget' task. You must have systems in place for versioning, monitoring, and communicating its value to ensure its long-term success.
From Code to Production: A Practical Checklist
Putting a model into production involves more than just the model file. You need a disciplined, reproducible process. This is where MLOps (Machine Learning Operations) principles become absolutely essential.
One of the biggest challenges is simply keeping track of everything. What version of the data was used to train this specific model? What were the exact hyperparameters? Tools like DVC (Data Version Control) were designed to solve this very problem. It works alongside Git to version your large datasets and models, ensuring you can always trace a prediction back to its origins.
Properly managing the project from start to finish is essential for this final step. To ensure you have all the pieces in place, it's helpful to review a structured framework.
Once deployed, your job isn't over. The real world is dynamic, and your model's performance can degrade over time—a phenomenon known as model drift. This happens when the new data your model sees in production starts to look different from the data it was trained on. You need to set up monitoring systems to track your model's key metrics and alert you when its performance drops below an acceptable threshold.
The Art of Data Storytelling and Driving Impact
A deployed model is a technical win, but translating its output into business impact requires clear communication. You can't just hand a stakeholder a spreadsheet full of probabilities; you have to tell a compelling story with the data.
This is where you build a narrative around your project's findings. Create intuitive dashboards using tools like Streamlit or Tableau that allow non-technical users to interact with the model's insights. For our churn project, a dashboard could let a marketing manager filter at-risk customers by region or subscription plan, turning raw predictions into a targeted action plan.
The scale of this opportunity is enormous. The Big Data and analytics sector, a core driver of these projects, is projected to surge from $307.51 billion in 2023 to $924.39 billion by 2032. This growth reflects a massive global investment in turning data into a competitive edge, emphasizing the need for data scientists who can not only build models but also prove their value.
When you present your work to leadership, focus on the business impact and ROI, not the technical jargon. Instead of talking about F1-scores, deliver an actionable insight: talk about the $50,000 in revenue you saved last month by reducing churn by 15%. This is how you secure buy-in, justify resources, and ensure your project creates lasting organizational change.
As you wrap up a data science project, or even while you're in the thick of it, some common questions always seem to pop up. Let's tackle a few of the most frequent ones I've encountered over the years. These are the kinds of things that can trip up even experienced teams, so having a clear answer ready is a game-changer.
How Do I Choose the Right Project to Start With?
When you're new to this, it's tempting to swing for the fences and pick a huge, complex project. My advice? Don't. Your first project should be a balancing act between high business impact and low technical complexity.
Look for a nagging, well-defined problem in the business where you already have access to the necessary data. A "quick win" is what you're after. For instance, a practical first project could be figuring out the top drivers of customer support tickets, which is often far more valuable and achievable than trying to build a massive recommendation engine from scratch on day one.
Picking a project with a clear scope builds momentum. More importantly, it earns you trust with stakeholders, paving the way for more ambitious projects down the road. Stay away from anything with vague goals or a project that needs months of data collection before you can even start modeling.
What Is the Difference Between Data Analysis and Data Science?
This is a classic point of confusion, but there's a simple way to think about it: one looks at the past, and the other looks to the future.
- Data Analysis is all about looking backward. It digs into historical data to answer questions like, "What were our best-selling products last quarter?" The goal is to pull out trends and insights from things that have already happened.
- Data Science often uses those insights to look forward. It involves building predictive models to forecast what might happen next, answering questions like, "Which products are these customers most likely to buy next month?"
A proper data science project almost always starts with data analysis. You can't predict the future without first understanding the past.
A practical example: A data analyst might build a dashboard showing historical customer churn rates. A data scientist takes that and builds a model to predict which specific customers are at risk of churning next.
How Do I Handle Stakeholders Who Keep Changing the Project Scope?
Ah, scope creep—the silent killer of many great projects. The secret to taming it lies in proactive communication and sticking to a structured process.
This is where that project charter we talked about earlier becomes your best friend. Get it created and signed off by all key stakeholders right at the start. It's now your "source of truth" for the project's goals and boundaries.
When a new request inevitably comes in, don't just say yes or no. Document it. Analyze how it will affect the timeline, budget, and original goals. Frame the discussion around trade-offs. You could say, "That's a great idea. We can definitely add a real-time alerting feature. Our initial estimate shows it would push the launch back by three weeks and increase our cloud costs. Is that a trade-off we're comfortable with for this first phase?" This shifts you from being a gatekeeper to a strategic partner, helping the business make smart, informed decisions.
A well-oiled data science project relies on a team of specialists working in harmony. Knowing who does what is critical for things to run smoothly.
Data Science Project Roles and Responsibilities
Here’s a quick breakdown of the typical roles you'll find on a data science team and what they're responsible for.
| Role | Primary Responsibility | Key Skills |
|---|---|---|
| Data Scientist | Develops models, performs analysis, engineers features. | Statistics, Machine Learning, Python/R, SQL |
| Data Engineer | Builds and maintains data pipelines and infrastructure. | ETL, Big Data Tech (Spark), Cloud Platforms |
| Business Analyst | Defines business requirements and translates them for the tech team. | Domain Knowledge, Communication, SQL |
| Project Manager | Oversees timeline, resources, and stakeholder communication. | Agile/Scrum, Risk Management, Leadership |
Each role is a crucial piece of the puzzle. When everyone understands their part and communicates effectively, you're set up for success.
At DATA-NIZANT, our goal is to cut through the noise and make complex topics like AI and data science accessible. Our expert-led articles give you the practical, real-world insights needed to bring your ideas to life. To keep learning, explore our knowledge hub and stay ahead of the curve.

