
Data visualization transforms raw numbers into compelling stories, but a poorly designed chart can do more harm than good, leading to confusion, misinterpretation, and flawed decisions. This article moves beyond theory to dissect real-world examples of bad data visualization. We won't just showcase charts that fail; we'll break down the specific reasons why they are ineffective and provide actionable insights to avoid these common blunders. By analyzing these mistakes, you will learn how to build visualizations that communicate with clarity and integrity.
Each example serves as a practical lesson, complete with actionable takeaways you can apply to your own work. We will explore everything from manipulated axes and distorted perspectives to confusing color schemes and illogical chart choices. Sometimes, the problem begins long before the chart is even created. As discussed in our post on data-driven decision-making, high-quality data is the foundation of any good visualization. Often, this starts with proper data collection; learning about 8 common bad survey questions to avoid can prevent such issues from the start.
Let's examine these cautionary tales to sharpen your critical eye and elevate your data storytelling skills, ensuring your visualizations always communicate the truth, clearly and accurately.
1. Fox News Bar Chart Manipulation (Minimum Wage)
One of the most frequently cited examples of bad data visualization involves manipulating a chart's baseline to exaggerate differences. In a 2013 segment, Fox News presented a bar chart comparing the then-current minimum wage of $7.25 to a proposed wage of $10.10. While the numerical increase was about 39%, the visual representation was wildly distorted, making the proposed wage bar appear over five times taller than the original.
This distortion was achieved by "truncating" the y-axis, meaning the baseline did not start at zero. By starting the vertical axis just below the lowest value (e.g., at $7.00), the relative difference between the bars becomes visually enormous. This tactic preys on our tendency to compare the heights of bars rather than scrutinizing the axis labels, effectively misleading the viewer into perceiving a much larger change than what actually exists.
Strategic Analysis: Why It Fails
The core failure of this visualization is its violation of the proportional ink principle. This principle states that the amount of ink used to represent a value should be directly proportional to the value itself. By truncating the y-axis, the chart creates a deceptive visual-to-data ratio.
- Misleading Proportions: The visual comparison suggests a monumental, perhaps radical, increase, which frames the policy proposal in a more extreme light.
- Erosion of Trust: Such overt manipulation damages the credibility of the source. For professionals in data science, this is a cardinal sin that undermines the goal of objective, data-driven decision-making.
The following bar chart illustrates how a truncated y-axis can visually distort the comparison between the two minimum wage values.
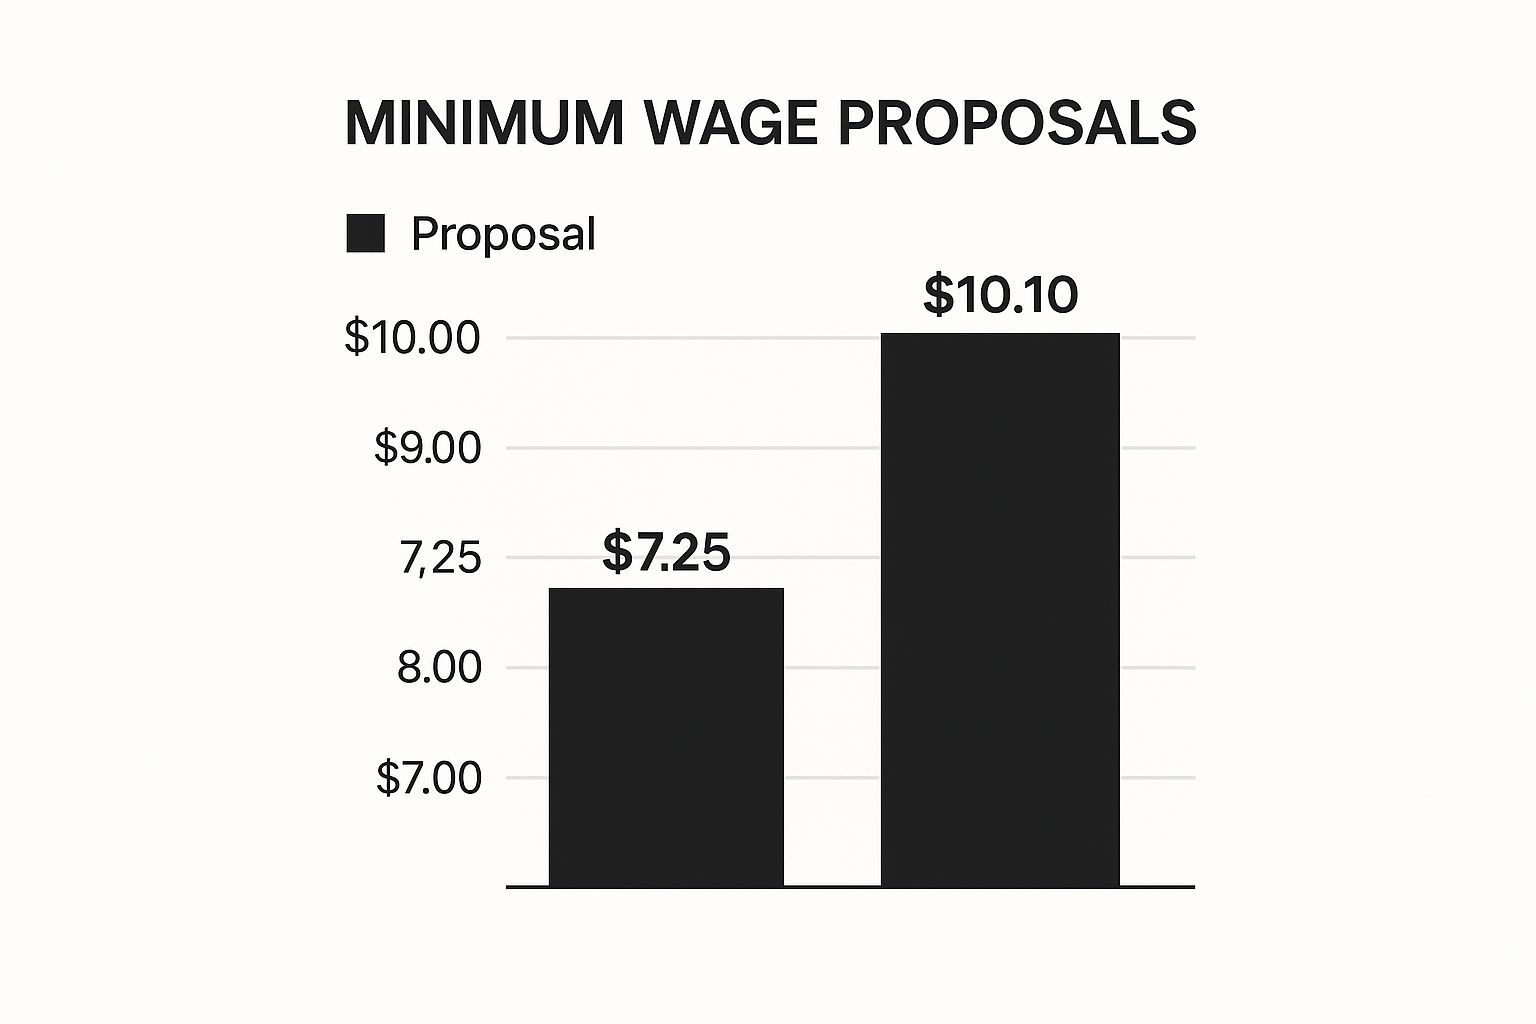
This visualization clearly shows that by starting the axis at $7.00, the $10.10 bar appears several times taller than the $7.25 bar, creating a misleading impression of the actual 39% difference.
Actionable Insight
To avoid this common pitfall and ensure your visualizations are honest and effective, follow these key practices:
- Always Start Bar Charts at Zero: The baseline for any bar chart must start at zero. This ensures the length of the bars accurately reflects their value and maintains proportional accuracy. Practical Example: If you are comparing sales figures of $500K and $550K, starting the y-axis at $450K will make the difference look enormous. Start at zero to show it’s a 10% increase, not a 100% one.
- Clearly Label Axes: Ensure both the x and y axes are clearly and accurately labeled with units of measurement. This provides essential context for the viewer.
- Prioritize Clarity Over Drama: The goal of data visualization is to communicate information clearly, not to create sensationalism. An ethical approach builds trust and supports better outcomes in data-driven decision-making.
2. Florida Gun Deaths Visualization by Reuters/Florida Department of Law Enforcement
Another prominent example of bad data visualization involves inverting a chart's axis, which fundamentally misleads the audience about the data's trend. In 2014, Reuters published a graphic about gun deaths in Florida following the enactment of its "Stand Your Ground" law. The chart depicted the number of murders committed using firearms, but the y-axis was flipped, with zero at the top and the maximum value at the bottom.
This unconventional orientation made the red area, representing deaths, grow downward over time. For any standard reader, a downward trend signifies a decrease. However, in this case, the data showed that gun deaths were actually rising significantly. This design choice created a direct contradiction between the visual narrative (deaths are falling) and the factual data (deaths are rising), causing widespread confusion and criticism for its deceptive nature.

Strategic Analysis: Why It Fails
The primary failure of this visualization is its violation of established charting conventions. For centuries, cartesian coordinate systems have trained us to associate "up" with "more" and "down" with "less." Inverting the y-axis exploits this ingrained cognitive shortcut to present a false narrative, regardless of whether the intent was malicious or merely a poor creative decision.
- Cognitive Dissonance: The chart forces the viewer to fight their own intuition. This creates cognitive dissonance, where the visual information conflicts with the numerical labels, making accurate interpretation difficult and frustrating.
- Deceptive Storytelling: The visual story suggests the "Stand Your Ground" law was followed by a decrease in gun deaths, when the opposite was true. This is a severe ethical breach in data journalism and reporting.
This chart is a classic case of how creative design choices, when untethered from fundamental principles of data representation, can result in disinformation.
Actionable Insight
To prevent such profound misinterpretations, data professionals must adhere to standard conventions that prioritize clarity and honesty.
- Follow Conventional Axis Orientations: For line and area charts, the y-axis value should always increase as it goes up. An inverted axis should only be used in rare, specific cases (like depicting depth) and must be explicitly called out to avoid confusion. Practical Example: When charting company revenue over time, an upward-sloping line must always represent growth. Inverting the axis to make losses look like gains is a critical error.
- Ensure Visual Trends Match Data Trends: Before publishing, perform a simple check: does a line going up represent an increase in the data? If not, the chart is flawed. The visual encoding must directly map to the data's meaning.
- Test Visualizations with Neutral Observers: Ask someone unfamiliar with the data to interpret your chart. Their first impression is a powerful test of whether your visualization communicates its message clearly or creates unintended confusion.
3. USA Today's Pie Chart Exceeding 100%
A pie chart is one of the simplest forms of data visualization, designed to represent parts of a whole. Its foundational rule is that all its slices must add up to 100%. One of the most infamous examples of bad data visualization comes from USA Today, which published a pie chart where the percentages totaled a staggering 193%. This fundamental mathematical error completely invalidates the chart's purpose.
This mistake typically occurs when a survey allows for multiple responses. For instance, if people are asked to name all the devices they own (e.g., smartphone, laptop, tablet), the percentages for each category will not sum to 100% because individuals can fall into multiple categories. A pie chart is wholly inappropriate for this type of data, as it incorrectly implies that each response is a mutually exclusive part of a single whole.

This graphic is a classic case of choosing the wrong chart type for the data, leading to a visualization that is not just misleading but mathematically nonsensical. It undermines the credibility of the entire report and serves as a cautionary tale for data professionals.
Strategic Analysis: Why It Fails
The failure here is a misunderstanding of a chart's basic function. A pie chart's visual grammar is built on the concept of a complete circle representing 100%. Violating this rule breaks the chart's logic and renders it meaningless, making it a prime example of bad data visualization.
- Fundamental Misrepresentation: The chart fails its primary objective: to accurately represent data. By exceeding 100%, it presents a logical impossibility that confuses the audience and miscommunicates the survey's findings.
- Wrong Tool for the Job: This error reveals a flawed data analysis process. The creator did not recognize that "select all that apply" data cannot be visualized in a pie chart and requires a different approach, such as a bar chart.
The incident highlights the importance of matching the visualization method to the data's structure. Understanding various data analysis techniques is crucial to avoid such elementary yet damaging mistakes.
Actionable Insight
To prevent this type of error and ensure your visualizations are accurate and effective, consider the following best practices:
- Always Verify Your Numbers: For any pie chart or part-to-whole visualization, double-check that the sum of all segments equals exactly 100%. This simple verification step can prevent major errors.
- Use Bar Charts for Multiple Responses: When dealing with data from "select all that apply" questions, a bar chart is the appropriate choice. Each bar can represent a category, and its length can show the percentage of respondents who selected it without creating a false "whole." Practical Example: To show which social media platforms users are on, a bar chart is ideal because a user can be on Facebook (80%), Instagram (65%), and Twitter (50%). A pie chart would be impossible.
- Implement a Peer Review Process: Before publication, have a colleague or manager review your visualizations. A second pair of eyes is invaluable for catching errors in logic, calculation, or chart selection.
4. CNN's 3D Pie Chart Distortion
Another classic entry in the gallery of bad data visualization is the use of 3D pie charts, a technique frequently seen on news networks like CNN. While visually dynamic, adding a third dimension to a pie chart introduces severe perceptual distortions. The perspective effect makes slices in the foreground appear significantly larger than slices of the same value in the background.
This manipulation exploits our brain's struggle to accurately interpret the angled, 3D shapes. A segment at the front of the chart might represent 25% of the data but occupy a much larger visual area than a 30% segment positioned at the back. This creates a misleading hierarchy, drawing the viewer's attention to the foreground slice and exaggerating its importance, regardless of its actual data value.
Strategic Analysis: Why It Fails
The fundamental failure of the 3D pie chart is its violation of perceptual accuracy. Data visualization should make comparisons easier and more intuitive, but the 3D effect actively works against this goal, forcing the viewer to fight against optical illusions to understand the data.
- Distorted Proportions: The tilted perspective skews the area of each slice, making direct visual comparison impossible. This is a critical flaw, as the primary function of a pie chart is to show part-to-whole relationships.
- Aesthetics Over Accuracy: This is a clear case of prioritizing flashy graphics over clear communication. The "chart junk" of 3D rendering adds no informational value and only serves to confuse and mislead the audience.
The 3D effect creates a visual lie, where the perceived size of a segment is not proportional to its value. This misleads the audience by implicitly suggesting that foreground elements are more significant.
Actionable Insight
To present proportional data accurately and ethically, data practitioners must avoid these stylistic traps. The focus should always be on clarity and truthful representation.
- Stick to 2D: When using a pie chart (or its alternatives like a donut chart), always use a flat, 2D design. This ensures that the area of each slice is directly proportional to its value, allowing for honest visual comparison.
- Label Slices Directly: Instead of relying on a separate legend, place data labels and percentages directly on or next to their corresponding pie slices. This reduces the cognitive load on the viewer.
- Consider Alternatives: For comparisons between multiple categories, a simple bar chart is often a more effective and less ambiguous choice than a pie chart. Practical Example: If you need to compare market share for five competitors (e.g., 30%, 28%, 20%, 12%, 10%), a bar chart makes it easier to see the small difference between 30% and 28% than a pie chart does. For more information on choosing the right chart, explore these data visualization best practices.
5. Georgia Department of Public Health COVID-19 Cases Chart
During the height of the COVID-19 pandemic in 2020, a chart from the Georgia Department of Public Health (DPH) became a notorious example of misleading data visualization. The bar chart was designed to show the top five counties with the greatest number of new COVID-19 cases over a 15-day period. However, the dates on the x-axis were not presented in chronological order.
Instead, the dates were rearranged to create the visual illusion of a steady decline in cases, with the tallest bars on the left and the shortest on the right. This manipulation directly contradicted the actual trend in the data, which was fluctuating. This chart is a powerful example of how reordering time-series data can fundamentally distort its meaning, presenting a dangerously false narrative during a public health crisis.
Strategic Analysis: Why It Fails
The primary failure here is the deliberate violation of a fundamental convention for time-series data: the x-axis must always represent time in a sequential, chronological order. By scrambling the dates, the visualization breaks the logical flow of information and manufactures a trend that does not exist.
- Deceptive Narrative: The reordered axis creates a false sense of security by showing a "downward trend." This misleads the public and policymakers about the true state of the pandemic in those counties.
- Destruction of Context: Time-series data derives its meaning from sequence. Removing this sequence makes it impossible to understand patterns, seasonality, or the impact of interventions over time. For data professionals, this is a glaring error that undermines the entire purpose of the chart.
Actionable Insight
Ensuring the integrity of time-series visualizations is critical, especially when communicating high-stakes information. The following practices can prevent such critical errors.
- Strict Chronological Order: Always ensure that any data plotted over time uses a sequential, correctly ordered axis. This is a non-negotiable rule for line charts, bar charts, and area charts representing temporal data. Practical Example: When creating a chart of monthly website traffic for the last year, ensure the months are ordered Jan, Feb, Mar, etc., not sorted by the traffic volume.
- Implement Data Validation: Before publishing, visualizations should undergo a rigorous review process. Automated checks can help verify data integrity, such as ensuring dates are sequential. Effective data cleaning and validation are foundational steps to prevent such mistakes.
- Peer Review for Public Communications: For critical information, especially in public health, multiple people should review charts for clarity, accuracy, and potential for misinterpretation. A fresh pair of eyes can often spot manipulations or errors that the creator might miss.
6. Business Insider's Correlation vs. Causation Chart
One of the most classic statistical traps is mistaking correlation for causation, and visualizations can make this error dangerously persuasive. Publications like Business Insider have sometimes presented charts showing a strong relationship between two completely unrelated variables, such as the divorce rate in Maine and per capita margarine consumption. While mathematically correlated, there is no logical causal link; a third, unmentioned factor (a confounding variable), or pure coincidence, is the likely explanation.
These charts often go viral because they are humorous and surprising, yet they represent a significant failure in data communication. By plotting two unrelated trends on the same graph, the visualization implies a relationship that doesn't exist. This misleads readers who may not have a strong statistical background, leading them to draw false conclusions from the data. The creator of the popular "Spurious Correlations" website, Tyler Vigen, has cataloged hundreds of these to highlight the absurdity of this logical fallacy.
Strategic Analysis: Why It Fails
The primary failure here is a lack of context and a violation of responsible data storytelling. A chart is not just a collection of data points; it is an argument. Presenting a spurious correlation without explicit disclaimers is intellectually dishonest and a prime example of bad data visualization.
- Implied Causality: The human brain is wired to find patterns. When two lines on a chart move in tandem, our immediate instinct is to assume one causes the other.
- Lack of Context: The visualization fails to explain why the correlation is meaningless. It omits any discussion of confounding variables, coincidence, or the fundamental principles of statistical analysis.
- Misinformation Spread: These charts are easily shared and can propagate statistical illiteracy, reinforcing the idea that if data is presented in a chart, it must be meaningful.
Actionable Insight
To present correlations responsibly and avoid creating misleading visualizations, data professionals must provide layers of context and clarity.
- Explicitly State "Correlation Is Not Causation": Always include a clear disclaimer on or near the chart that explains the relationship is correlational and does not imply one variable causes the other.
- Discuss Potential Confounding Variables: If two variables like ice cream sales and drowning deaths are correlated, explain the likely third factor (e.g., warm weather) that influences both. This adds crucial context. Practical Example: When presenting a chart showing a correlation between a marketing campaign spend and overall company revenue, you must also mention other factors like seasonal demand or a competitor's market exit that could have influenced sales.
- Prioritize Responsible Storytelling: Frame the visualization as an example of a statistical pitfall rather than a genuine discovery. Learn more about how to identify and avoid these misleading relationships in our guide to spurious correlation examples.
7. Apple's iPhone Sales Growth Chart
Even giants like Apple can produce misleading visuals. A famous example comes from a 2008 presentation where Steve Jobs unveiled a chart depicting cumulative iPhone sales. While the numbers were technically correct, the chart used inconsistent intervals and area representation, making modest early growth appear exponential and creating a visually deceptive growth trajectory.
The chart displayed cumulative sales at different points in time, but the time intervals between the data points were not uniform. By compressing the time scale in the early stages and stretching it out later, the growth curve was artificially steepened. This visual trickery makes the sales growth seem far more dramatic and explosive than a uniformly scaled chart would have revealed, serving marketing goals at the expense of data accuracy.
Strategic Analysis: Why It Fails
This visualization fails because it violates the fundamental principle of consistent scaling. Data charts must use a constant scale on their axes to allow for fair, at-a-glance comparisons. Manipulating the scale or intervals distorts the viewer's perception of trends and rates of change.
- Deceptive Trajectory: The inconsistent time axis creates a false impression of acceleration. The viewer perceives a smooth, rapidly increasing curve, when the actual growth pattern was more measured.
- Lack of Context: By focusing on cumulative numbers without consistent time intervals, the chart obscures the actual sales performance within each period. This is a classic example of how to lie with statistics, making it a poor choice for any analysis aiming for clarity.
This is a prime example of how even correct data can be presented in a misleading way, a key pitfall among examples of bad data visualization. Such a chart prioritizes a marketing narrative over transparent communication, which can mislead investors and consumers alike.
Actionable Insight
To present growth data honestly and effectively, it is crucial to maintain visual integrity. Follow these guidelines to avoid similar mistakes:
- Use Consistent Scaling: Always ensure that the intervals on your axes are uniform. Whether you are plotting time, money, or units, each increment on the axis should represent the same value. Practical Example: When showing quarterly sales, the space between Q1 and Q2 should be the same as the space between Q2 and Q3. Don't skip a quarter or compress the timeline to hide a dip.
- Provide Actual Numbers: Label key data points directly on the chart or provide an accompanying table. This allows the audience to verify the visual information against the raw data, promoting transparency.
- Balance Marketing with Accuracy: While the goal may be to tell a compelling story, that story must be grounded in an honest representation of the data. Prioritizing data accuracy builds long-term trust, which is essential for effective data storytelling.
8. Women's Magazine Weight Loss Infographic
Many women's magazines and fitness industry marketers use infographics to showcase dramatic "before and after" weight loss results. These visualizations often employ misleading tactics, such as inconsistent scaling, cherry-picked data, and distorted proportions, to exaggerate outcomes. By focusing only on the most extreme success stories, they present exceptional results as typical, creating unrealistic expectations for the average person.
This approach is a classic example of bad data visualization because it prioritizes sensationalism over accuracy. Instead of providing an honest representation of average outcomes, these charts use visual tricks to amplify a marketing message. For instance, a "before" image might be subtly widened or shot from a less flattering angle, while the "after" image is manipulated to appear slimmer, with scales on accompanying charts that are often inconsistent or completely absent.
Strategic Analysis: Why It Fails
The primary failure of these infographics is their deliberate misrepresentation of data to exploit the viewer's emotional response. They violate fundamental principles of data ethics by presenting biased, non-representative information as factual evidence of a product or program's effectiveness.
- Cherry-Picking Data: These visualizations exclusively feature outlier results. By ignoring the data from individuals who had modest or no success, they create a skewed and deceptive picture of what customers can expect.
- Lack of Context and Scale: Often, these graphics lack any statistical context, such as the average weight loss, the standard deviation, or the percentage of participants who achieved the highlighted results. This omission prevents the audience from making an informed judgment.
- Psychological Manipulation: The design is intended to prey on insecurities and desires for rapid transformation, which is an unethical use of data visualization that can have negative psychological impacts on the audience.
Actionable Insight
To create ethical and effective visualizations, especially with sensitive data like health outcomes, prioritize transparency and accuracy over marketing hype.
- Represent the Full Data Set: Instead of showing only the best-case scenarios, use visualizations like box plots or histograms to show the full distribution of results. This provides an honest look at the typical, best, and worst outcomes. Practical Example: A pharmaceutical company should show a chart with the full range of patient responses to a new drug, not just the two patients who were cured.
- Maintain Consistent Visual Scales: When making "before and after" comparisons, ensure all visual elements use a consistent and clearly labeled scale. Proportions should accurately reflect the numerical data without distortion.
- Provide Complete Context: Always include essential statistical context. Clearly state what the average result is and provide a disclaimer that "results are not typical" if showcasing an outlier. This commitment to transparency is a cornerstone of effective data storytelling.
8 Examples of Flawed Data Visualizations
| Example Title | Implementation Complexity 🔄 | Resource Requirements ⚡ | Expected Outcomes 📊 | Ideal Use Cases 💡 | Key Advantages ⭐ |
|---|---|---|---|---|---|
| Fox News Bar Chart Manipulation (Minimum Wage) | Low – simple bar chart with axis manipulation | Low – basic charting tools needed | Misleading exaggeration of differences | Political commentary | High visual impact, easy to create but deceptive |
| Florida Gun Deaths Visualization | Medium – inverted y-axis and area fill | Medium – requires timeline data | Confusing trend interpretation | Crime statistics reporting | Eye-catching visual, highlights annotations |
| USA Today's Pie Chart Exceeding 100% | Low – basic pie chart with calculation errors | Low – standard charting | Invalid proportions, viewer confusion | Survey result summaries | Simple to produce but mathematically flawed |
| CNN's 3D Pie Chart Distortion | Medium – 3D rendering and perspective effects | Medium – advanced graphics tools | Distorted perception of proportions | TV news graphics | Visually appealing, consistent branding |
| Georgia Department COVID-19 Cases Chart | Medium – time-series with non-chron order | Medium – requires trusted data | Misleading temporal trend | Public health data communication | Official data source, impactful but misleading |
| Business Insider's Correlation vs. Causation | Low – scatter or line charts | Low – standard statistical tools | Misinterpretation of statistical relationships | Statistical data presentations | Demonstrates correlations clearly, lacks context |
| Apple's iPhone Sales Growth Chart | Medium – scaling and visual emphasis | Medium – corporate presentation design | Exaggerated growth impression | Marketing presentations | Polished visuals, persuasive to audiences |
| Women's Magazine Weight Loss Infographic | Medium – before/after graphics & scale adjustment | Medium – graphic design and data selection | Unrealistic expectations from visuals | Health and fitness marketing | Engaging and dramatic, emotionally persuasive |
From Mistakes to Mastery: Your Path to Better Data Visualization
We have journeyed through a collection of compelling examples of bad data visualization, each serving as a powerful lesson in what not to do. From the manipulated bar charts of Fox News to the confusing inverted y-axis in the Florida gun deaths graph, a clear pattern emerges. The most significant failures in data visualization happen when the core principles of clarity, honesty, and audience understanding are sacrificed for aesthetic flair or a predetermined narrative.
The key takeaway is that effective data visualization is not an art of persuasion but an act of communication built on trust. Every choice is critical. The scale of an axis, the selection of a chart type, or the use of color can either illuminate the truth or create a fog of misinformation. As we saw with the Georgia DPH COVID-19 chart, even unintentional errors can erode public trust and lead to poor decision-making, highlighting the immense responsibility that comes with presenting data.
Your Action Plan for Visualization Excellence
Learning from these mistakes is the first step. The next is to actively integrate best practices into your own workflow. The goal is to move beyond simply avoiding errors and start creating visuals that are intuitive, impactful, and ethically sound. Think of it as developing a "visualization conscience" that guides your design choices.
To put these lessons into practice, consider the following actionable steps:
- Prioritize Function Over Form: Before choosing a chart, ask yourself: What is the single most important message I need to convey? Select the visualization type that answers this question most directly. A simple bar chart often tells a clearer story than a complex 3D pie chart.
- Embrace Simplicity and Clarity: Eliminate anything that does not serve the data's story. This includes removing distracting gridlines, unnecessary 3D effects, and chart junk. The goal is to maximize the data-ink ratio, as advocated by experts like Edward Tufte.
- Commit to Data Integrity: Always start your y-axis at zero for bar charts to avoid distorting proportions. Ensure pie chart segments add up to 100%. Scrutinize your data sources and be transparent about their limitations.
By internalizing these principles, you shift from a creator of charts to a storyteller who uses data to build understanding and drive informed action. To help solidify your understanding and move towards creating impactful visuals, explore resources featuring effective KPI dashboard examples that put these best practices into action. Learning from these positive examples is just as crucial as analyzing the negative ones we've discussed.
Ultimately, mastering data visualization is a journey of continuous learning and refinement. The examples of bad data visualization we've examined are not just cautionary tales; they are invaluable signposts guiding us toward a more rigorous, ethical, and powerful approach. By committing to this path, you equip yourself and your organization to harness the true potential of data, transforming complex information into clear, actionable insights that foster innovation and build a foundation of trust.
Ready to move from theory to application? DATA-NIZANT provides the tools and training to help you and your team master the art and science of data visualization. Turn these lessons into institutional knowledge and ensure every chart you create is a model of clarity and integrity.

