
The data science life cycle is more than just a buzzword; it's a structured framework that guides a project from a simple business question all the way to a deployed, working model. Think of it less like a rigid set of rules and more like a flexible roadmap. Its real purpose is to make sure data projects deliver tangible business value instead of getting lost in a sea of interesting but ultimately useless technical details.
Demystifying the Data Science Roadmap
At its heart, the data science life cycle provides a methodical way to tackle complex problems with data. It breaks down what could be an overwhelming task into manageable, distinct phases, each with its own clear goals and activities.
Without this structure, it's incredibly easy for teams to go off track. They might chase fascinating but irrelevant analyses, waste tons of resources cleaning up poor-quality data, or—worst of all—build a technically brilliant model that doesn't actually solve the core business problem.
This framework is what turns raw, messy data into sharp, actionable business intelligence that drives better decisions. In fact, organizations that are heavily data-driven are three times more likely to report significant improvements in their decision-making.
The Detective Analogy
A great way to understand this process is to think of a detective solving a complex case. They don't just stumble around hoping to find clues. They follow a clear process:
- Understand the Crime: What exactly happened? What was the motive? This is your Business Understanding phase.
- Gather Evidence: They collect fingerprints, interview witnesses, and secure the crime scene. This is Data Collection & Preparation.
- Analyze the Clues: They look for patterns, connect the dots between different pieces of evidence, and form initial hypotheses. This is Exploratory Data Analysis.
- Build the Case: They construct a coherent story of what happened, backed by evidence. This is the Modeling stage.
- Present to the Jury: Finally, they have to clearly communicate their findings to people who weren't there. This is Deployment & Communication.
This methodical approach ensures a thorough investigation, just as the data science life cycle ensures a robust and valuable data project. For another perspective on this, it's worth seeing how others approach understanding a data science process.
A Glimpse into the Stages
To give you a clearer picture, here’s a quick summary of what each stage is all about.
Quick Overview of the Data Science Life Cycle
| Stage | Primary Goal | Practical Example |
|---|---|---|
| Business Understanding | Define the problem and project objectives. | Meeting with marketing to define "customer churn" and agree on a 90-day prediction window. |
| Data Collection | Gather all relevant data from various sources. | Querying the company's SQL database for user activity logs and joining it with CRM data. |
| Data Preparation | Clean, transform, and prepare the data for analysis. | Handling missing last_login_date values and creating a new feature like days_since_last_login. |
| Exploratory Data Analysis | Uncover patterns, anomalies, and insights in the data. | Creating a histogram of user session lengths to identify that highly engaged users have longer sessions. |
| Modeling | Build, train, and test predictive models. | Training a logistic regression model to predict churn based on user engagement features. |
| Model Evaluation | Assess the model's performance and accuracy. | Using a confusion matrix to see how many churning users the model correctly identified (recall). |
| Deployment | Integrate the model into a live production environment. | Creating an API that the marketing automation platform can call to get a daily list of at-risk users. |
This table provides a high-level map of the journey we're about to take.
This guide will walk you through each of these critical phases. The following diagram illustrates the very first step, Data Collection, showing how data flows from different sources and how its volume and frequency shape the project.
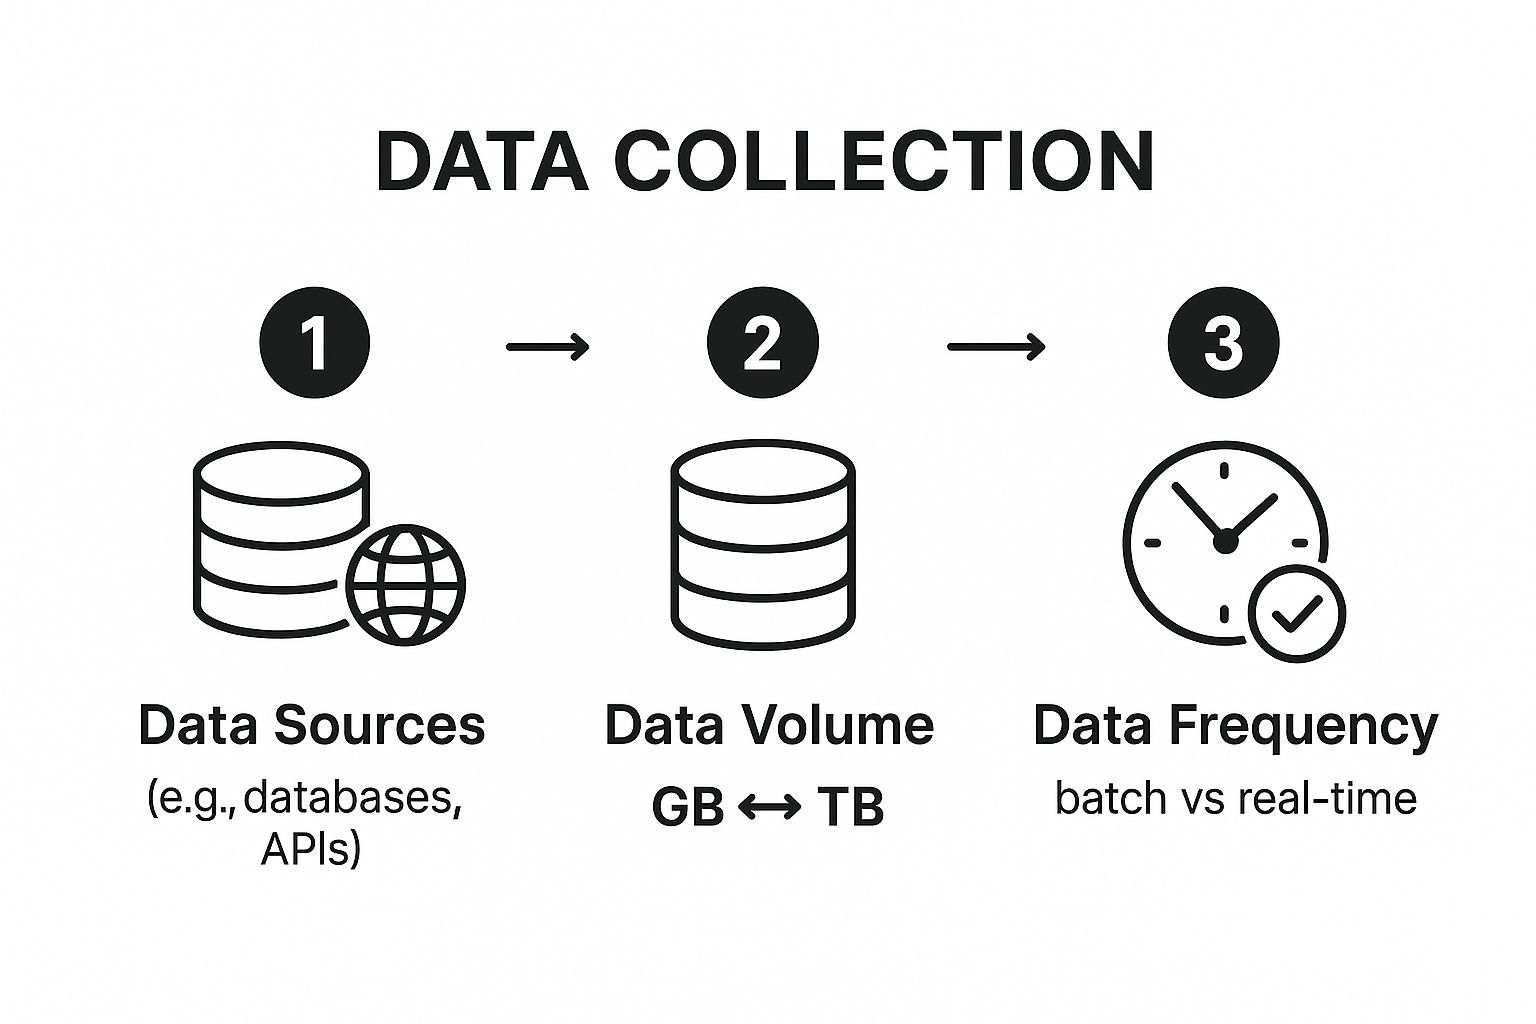
As you can see, effective data sourcing isn't just about grabbing files. It's about managing a mix of sources, planning for the scale of the data, and deciding whether you need to process it in batches or in real-time to meet the project's demands.
Defining the Problem and Sourcing Your Data
Every great data science project kicks off not with a fancy algorithm, but with a simple, well-defined question. In fact, the success of the entire data science life cycle is often decided right here, before you’ve written a single line of code. This first stage is really about two things: understanding what the business actually needs and figuring out where to find the data to get it done.

Think of it like planning a road trip. You wouldn't just hop in the car and start driving aimlessly. You'd pick a destination (the business goal) and then gather what you need to get there—a map, a car, and gas (your data). Kicking off a project without a clear objective is just asking to get lost.
Asking the Right Questions
The real foundation of any project is turning a fuzzy business goal into a sharp, measurable, and answerable question. Vague requests like "improve user retention" are impossible to tackle head-on. You have to dig deeper with stakeholders and brainstorm what that really means.
Practical Example: Let's say a SaaS company wants to figure out which of its free-tier users are most likely to upgrade to a paid plan.
A poorly defined goal sounds like this: "Let's find out why users upgrade." It's a start, but it's not a destination.
A well-defined goal is much more specific: "Can we build a model that predicts, with at least 80% accuracy, which users on our free plan will upgrade to a paid subscription within the next 30 days based on their in-app behavior over their first two weeks?"
Now that is a powerful question. It sets crystal-clear success criteria. You know exactly what you’re building, what data you’ll probably need, and how you'll measure whether you've succeeded. This kind of precision is vital for setting expectations and making sure your work delivers real business value.
Actionable Insight: The most critical step in the data science life cycle is defining a precise, falsifiable hypothesis. A clear question not only guides your data sourcing but also provides the metrics you'll use to evaluate your final model. For instance, knowing you need to predict upgrades within 30 days tells you exactly how to label your training data.
Mapping Out the Project Charter
Once the question is locked in, the next move is to formalize it with a project charter. This document is your blueprint, the North Star for the entire project that keeps everyone on the same page. A solid charter is your best defense against "scope creep"—that pesky habit projects have of growing bigger and bigger over time.
Your charter should spell out:
- Project Objective: The specific business question you're answering.
- Key Performance Indicators (KPIs): How you'll measure success (e.g., model accuracy, predicted revenue lift).
- Data Sources: A list of all the potential places you'll need to get data from.
- Stakeholders: Who needs to be kept in the loop and who will ultimately use what you build.
- Expected Outcomes: What the final deliverable looks like (e.g., a dashboard, an API, a report).
Laying this all out up front helps establish a solid statistical foundation for your work. To get a better handle on setting reliable performance thresholds for your model, our guide on understanding confidence level and significance level made simple is a great place to start.
The Reality of Sourcing Data
With a clear question in hand, the data hunt begins. In the real world, data is never just handed to you in a clean, tidy file. It's usually a mess, scattered across different systems, each with its own quirks and formats.
For our SaaS upgrade prediction example, you'd be pulling information from several different places:
- Internal Databases (CRM): Customer relationship management systems like Salesforce are goldmines for demographic data, sign-up dates, and company info.
- Product Usage Logs: These logs, often living in a data warehouse like Snowflake or BigQuery, track every click, feature used, and session duration.
- Third-Party APIs: Sometimes you need to enrich your data by calling external APIs, like using Clearbit to pull in more detailed company information for B2B users.
- Web Scraping: In some cases, you might even need to scrape publicly available data, like product reviews or social media chatter, to get a sense of user sentiment.
The challenge isn't just getting access to these sources; it's figuring out how to stitch them all together into a single, cohesive dataset. This initial phase sets the stage for everything that follows, making it one of the most strategic parts of the entire data science life cycle.
Preparing and Exploring Your Dataset
Once you’ve nailed down the business problem and gathered your raw data, you're stepping into what is easily the most critical—and often most demanding—part of the entire data science life cycle. This stage is all about data preparation and exploration, a two-part process that turns a messy, unreliable pile of data into a clean, structured asset ready for the spotlight.
Think of it like a chef prepping their ingredients. Before any real cooking happens, they're meticulously chopping, cleaning, and organizing. This is our mise en place.
This stage is where the old saying "garbage in, garbage out" really hits home. It's not uncommon for data scientists to spend up to 80% of their project time right here. Why? Because even the most powerful algorithm is useless if you feed it junk data. Getting this part right is the absolute foundation for building a model that works.
Turning Raw Data into a Pristine Asset
Let’s be honest: raw data is almost never ready to go. Before you can even think about analysis, you have to know how to clean data effectively to ensure your dataset is both trustworthy and usable.
Practical Example: For our SaaS company trying to predict which users will upgrade, the initial data pulled from product logs and the CRM is probably a mess. It's likely riddled with errors, missing entries, and inconsistent formats. Data preparation is the systematic cleanup that tackles these issues head-on.
Key prep tasks would look something like this:
- Handling Missing Values: Some user profiles might be missing the company size or industry. Do we toss those records? Fill in the blanks with a placeholder like "unknown"? Or do we use a statistical method to estimate the missing info? We have to make a call.
- Standardizing Formats: What if session times are logged in different time zones? They all need to be converted to a single standard, like UTC, so our calculations of user activity are actually accurate.
- Correcting Errors: You might find a user's login count is
-1because of a system bug. These kinds of obvious errors have to be found and fixed. - Feature Engineering: This is where we get creative and build more insightful features from what we already have. For instance, we could calculate a "feature adoption rate" by counting how many unique features a user tries within their first week, or
days_since_last_login.
This cleanup isn't just a chore; it’s your first real chance to understand the data's limits and quirks. Automating these steps can be a huge time-saver, a topic we dive into deeper in our guide to mastering automated data pipelines.
Actionable Insight: Don't just clean your data—document every single step. Keep a clear log of every transformation, deletion, and assumption you make. This "data diary" is priceless for reproducing your work and explaining your model's logic down the line. A practical tip is to use a version-controlled script (e.g., in Git) for your data cleaning process.
Uncovering the Story in Your Data
With clean data in hand, it’s time for the fun part: Exploratory Data Analysis (EDA). This is where you start a conversation with your data and let it tell its story. The goal isn't to build a model just yet, but simply to listen—to find patterns, spot anomalies, and form some early ideas that will shape your modeling strategy.
Think of yourself as a detective, interrogating the data.
For our SaaS company, EDA means asking questions and visualizing the answers:
- What does user activity look like? A histogram of daily logins might reveal that most free users are super active for the first few days, but then their engagement falls off a cliff. This suggests that the first week is a critical window for intervention.
- Is there a link between certain features and upgrades? A quick bar chart could show that users who touch the "collaboration" feature are five times more likely to upgrade. That’s a huge clue!
- Are there any wild outliers that could mess up our results? A box plot of session durations might show a few users with sessions lasting for days—almost certainly a bug that needs to be handled.
Visualizations are the language of EDA. Tools like Python's Seaborn and Matplotlib libraries are perfect for this, letting you quickly generate plots that build your intuition about the data's structure. This visual deep-dive is what stops you from making bad assumptions later and bridges the gap between raw data and real, predictive insight.
Building and Evaluating Predictive Models
Alright, we’ve done the hard work of cleaning and understanding our data. Now for the exciting part: building the predictive engine. This is where we move from historical facts to future insights, turning our dataset into a machine that can forecast what users will do next.
A common rookie mistake is to just grab the most powerful, complex algorithm you can find and throw it at the problem. But great modeling is more art than brute force. The real skill lies in picking the right tool for the job.

For our SaaS company trying to predict user upgrades, this is the moment of truth. We're about to build, tune, and test a model that can flag users who are ready to pay more. It's a process of careful selection and rigorous validation to make sure our predictions are not just accurate, but also dependable and make business sense.
Choosing the Right Algorithm
The first decision is which algorithm to start with. This isn't a random guess; it's guided by the type of problem we're solving (in this case, classification—will they upgrade or not?), the data we have, and how easily we need to explain the model's logic to the marketing team.
Let's look at two popular contenders for our user upgrade prediction:
- Logistic Regression: Think of this as the reliable, straightforward workhorse. It’s highly interpretable, meaning it clearly shows how factors like login frequency or specific feature usage directly impact the odds of a user upgrading. Its simplicity is a huge plus—it's fast, efficient, and super easy to explain to non-technical stakeholders. It’s the perfect starting point.
- Gradient Boosting (like XGBoost): This is the high-performance sports car of algorithms. It’s far more powerful and complex, building a series of decision trees where each one learns from the mistakes of the last. While it often delivers superior accuracy, it can be a "black box," making it tough to pinpoint exactly why it predicted a specific user would upgrade.
The best approach? Start simple. Train a Logistic Regression model first. This gives us a solid baseline for performance. Then, we can bring in a powerhouse like Gradient Boosting to see if the accuracy jump is big enough to justify the extra complexity.
The True Test: Evaluation Beyond Accuracy
Building a model is only half the battle. Proving it actually works—and works in a way that helps the business—is the other half. This evaluation stage is where many projects go wrong, often by fixating on a single, dangerously misleading metric: accuracy.
Accuracy just tells you the percentage of correct predictions. Sounds good, right? But it can mask serious problems. Imagine only 3% of your users ever upgrade. A lazy model that just predicts no one will upgrade would be 97% accurate. But for our business goal, it's completely useless.
This is why we need a smarter set of metrics. To get them, we rely on a tool called a confusion matrix, which neatly breaks down a model's performance into four distinct outcomes:
- True Positives (TP): The model correctly said a user would upgrade. (A correct 'yes')
- True Negatives (TN): The model correctly said a user would not upgrade. (A correct 'no')
- False Positives (FP): The model predicted an upgrade, but the user didn't. (A wrong 'yes'—a false alarm)
- False Negatives (FN): The model predicted no upgrade, but the user did. (A wrong 'no'—a missed opportunity)
From this matrix, we can calculate far more insightful metrics like precision (of all the users we flagged as likely to upgrade, how many actually did?) and recall (of all the users who actually upgraded, how many did our model successfully catch?).
Actionable Insight: Never judge a model by a single metric. The most valuable evaluation connects model performance directly to business impact by considering the cost of different types of errors. A practical step is to sit down with stakeholders and assign a dollar value to a False Positive (e.g., cost of a marketing email) and a False Negative (e.g., lost subscription revenue) to guide model tuning.
For our SaaS example, a false positive means we waste marketing dollars on someone who was never going to convert. A false negative is arguably worse—we completely miss a golden opportunity to engage a user who was ready to buy.
The business has to decide which error is more costly. If missing a potential sale is a bigger problem than some wasted ad spend, we'd tune our model for higher recall, even if it means accepting slightly lower precision. This focus on business context is what separates a model that's technically correct from one that delivers real-world value. As we've explored before on the Datanizant blog, truly understanding how a model performs under different conditions is the key to making it successful in the long run.
Choosing the Right Machine Learning Model
Selecting the right model is crucial. Here’s a quick guide to help you match common model types with business problems.
| Model Type | Business Problem Example | Strengths | Common Pitfalls |
|---|---|---|---|
| Linear/Logistic Regression | Predicting house prices based on features; classifying emails as spam or not. | Simple, fast, and highly interpretable. Great for establishing a baseline. | Assumes linear relationships; can be outperformed by more complex models. |
| Decision Trees / Random Forests | Identifying high-value customers; predicting patient readmission risk. | Handles non-linear data well; robust to outliers; Random Forests reduce overfitting. | Single trees can easily overfit; complex forests can be hard to interpret. |
| Gradient Boosting (e.g., XGBoost) | Fraud detection; predicting customer churn with high accuracy. | Extremely high predictive power; often wins machine learning competitions. | Can be slow to train; prone to overfitting if not tuned carefully; "black box" nature. |
| Clustering (e.g., K-Means) | Segmenting customers into distinct marketing groups; grouping news articles by topic. | Uncovers natural groupings in data without needing predefined labels. | Requires specifying the number of clusters; sensitive to the initial starting points. |
This table is a starting point. The best model for your project will always depend on your specific goals, data, and the trade-offs you're willing to make between accuracy, speed, and interpretability.
Deploying and Monitoring Your Models
A perfectly tuned model sitting in a Jupyter notebook provides exactly zero business value. The final frontier of the data science life cycle is deployment—getting your model out of a development environment and into the real world where it can start making predictions and shaping decisions. This is where the rubber meets the road.
But the work doesn't stop once the model goes live. In fact, that's just the beginning. Ongoing monitoring is just as vital, ensuring the model continues to perform as expected long after its initial launch. This is the stage that truly separates a one-off academic exercise from a robust, industrial-grade data science solution.
From Notebook to Production
So, what does deployment actually look like? It means integrating your model into existing business systems so its predictions can be used automatically.
Practical Example: For our SaaS company, this could mean embedding the upgrade prediction model directly into the marketing automation platform. Typically, the model is exposed via an API (Application Programming Interface), which allows other software to send it user data and get a prediction back in real-time.
Imagine the marketing platform sees a user performing certain high-value actions. It can then "ping" the model's API. If the model returns a high probability that the user will upgrade, the platform can automatically trigger a targeted email campaign with a special offer. This closes the loop, turning a prediction into direct business action. When putting models into service like this, a solid grasp of API testing is essential for keeping things reliable and stable.
This whole process of industrializing machine learning is known as MLOps (Machine Learning Operations). It’s a discipline focused on making the deployment, monitoring, and management of models systematic, repeatable, and scalable.
The rise of AI is really pushing MLOps forward. Generative AI models can automate parts of the data science workflow, making standardized model management more important than ever. This helps teams move away from manual, one-off deployments toward processes that can handle production scale.
The Silent Killer: Model Drift
Once a model is live, a new and subtle challenge emerges: the world changes. The patterns your model learned from historical data might not hold true six months from now. This slow decay in performance over time is called model drift, and it can happen for a few reasons:
- Concept Drift: The fundamental relationship between your features and what you're trying to predict changes. For example, a new competitor could launch a compelling free tier, completely changing what user behaviors lead to paid upgrades.
- Data Drift: The statistical properties of the input data change. Maybe the marketing team launches a new campaign that attracts a completely different type of user—one whose behavior your model has never seen before.
Without monitoring, drift can go completely unnoticed. Your model could start making increasingly inaccurate predictions, silently eroding business value while you think everything is fine. You might keep sending offers based on outdated assumptions, wasting resources and missing out on real opportunities.
Closing the Loop with Continuous Monitoring
Effective monitoring is the only real defense against model drift. It involves tracking key performance indicators over time to catch any degradation before it becomes a major problem.
Actionable Insight: For our SaaS upgrade model, this means we need to be constantly watching:
- Model Performance Metrics: Are precision and recall holding steady, or are they starting to drop? Tracking these metrics on new, live data is the most direct way to spot trouble.
- Data Distribution: Is the average number of daily logins for new users the same as it was last month? Monitoring the statistical distributions of your input features can give you an early warning of data drift.
- Business Outcomes: Are the users flagged by the model actually upgrading at the rate we expected? Tying model performance back to core business KPIs is the ultimate measure of success.
By setting up automated alerts for these metrics, you create a powerful feedback system. When performance dips below a certain threshold, it’s a clear signal that the model needs to be retrained on fresh data. This is where the "cycle" in the data science life cycle becomes real. Feedback from the deployed model informs the next iteration of the process, kicking off a continuous loop of improvement.
If you want to dive deeper into the nuts and bolts, you can learn more about the specifics of machine learning model monitoring in our detailed guide.
How AI Is Reshaping the Life Cycle
The traditional data science life cycle isn't some static blueprint set in stone. It’s constantly in motion, and the biggest driver of that change today is Artificial Intelligence. The explosion of sophisticated AI, especially generative models, is shaking up every single stage of the process, forcing data scientists to think differently and adopt far more powerful workflows.

One of the most profound shifts is the new-found focus on unstructured data. We're talking about the messy, human stuff—text from emails, images, audio files—that doesn’t fit nicely into the neat rows and columns of a database. It’s no surprise that a recent executive survey found 94% of data and AI leaders are intensifying their focus on data management because of AI's rise.
This is a huge deal. One large insurance company admitted that a staggering 97% of its data is unstructured, representing a massive, previously dark territory of untapped insight. You can dive deeper into this trend by checking out the full research on AI and data science for 2025.
Mining Unstructured Data for Intent
Let’s make this real. Imagine you want to predict which users are likely to upgrade their software subscription. In the past, you might have just looked at product usage logs. Now, you can feed a model thousands of customer support tickets.
These tickets are a goldmine of raw, unstructured text. They contain direct customer feedback, frustrations, and feature requests. A user writing, "I keep hitting the project limit, it's really slowing me down," isn't just complaining; they're broadcasting a clear signal—a strong intent to upgrade if you offer them a solution.
Of course, working with this kind of data introduces new wrinkles in the preparation phase.
- Text Vectorization: Models don't speak English; they speak math. You have to convert the words from those support tickets into numbers using techniques like TF-IDF or word embeddings (like Word2Vec) so an algorithm can actually make sense of them.
- Sentiment Analysis: You can also train a model to read the tone of each ticket. Is the user frustrated, happy, or neutral? This sentiment becomes another powerful feature for your predictive model.
AI as a Data Science Co-Pilot
Beyond just unlocking new types of data, generative AI is quickly becoming an indispensable sidekick for data scientists. Think of it as a co-pilot, dramatically speeding up tasks that used to be manual, tedious, and time-consuming.
Actionable Insight: The modern data scientist is no longer just a model builder. They are a curator of diverse data types and a collaborator with AI tools. A practical action is to start using an AI coding assistant to generate boilerplate code for data cleaning or to quickly create different types of visualizations, freeing you up to focus on higher-level analysis.
For example, during data preparation, you could ask an AI assistant to instantly whip up a Python script to clean and standardize messy text data. When it's time for exploratory analysis, you can ask it to suggest hypotheses based on initial data summaries, potentially pointing you toward patterns you might have otherwise missed.
This dance between human intuition and AI's raw efficiency is completely redefining what’s possible. To get a complete picture of how all these pieces fit together, check out our complete guide to master the data science lifecycle.
Your Questions, Answered
As you get your hands dirty with the data science life cycle, a few practical questions always seem to pop up. Let's tackle some of the most common ones head-on.
Is the Data Science Life Cycle a Strict, Linear Process?
Not at all. While we often lay out the stages in a nice, neat sequence for learning purposes, the real world is a messy, iterative loop.
It's common for insights uncovered during exploratory analysis to send you right back to square one, forcing you to rethink the initial business problem. Poor model performance? That’s a ticket straight back to data prep to engineer better features. Think of it less like a straight line and more as a continuous cycle of learning and refinement.
How Long Does a Typical Data Science Project Take?
This is the classic "it depends" question. There's really no one-size-fits-all answer. A project’s timeline is completely tied to its complexity, the quality of the data you're working with, and the scope of the business goal.
A quick, focused exploratory analysis might be wrapped up in a week. On the other hand, building a complex recommendation engine from the ground up could easily take several months. A well-structured plan, like the ones we cover in our guide to data science project management, is crucial for setting timelines that aren't pure fiction.
Always remember that the data preparation phase is the silent time-eater. It's not unusual for it to consume up to 80% of the entire project timeline. Don't skimp here—clean data is everything.
What Are the Most Common Tools Used in the Life Cycle?
The toolkit changes depending on the stage, but most teams rely on a core stack of technologies.
- Analysis & Modeling: Python is the dominant force here, with libraries like Pandas, Scikit-learn, and TensorFlow doing the heavy lifting. R is also a strong contender, especially in academia.
- Data Extraction: SQL is still king for pulling data from relational databases. It's a non-negotiable skill.
- Visualization: Tools like Tableau are popular for building dashboards, while Python's Matplotlib and Seaborn are fantastic for in-depth exploratory work.
- Deployment & MLOps: The big cloud platforms—AWS, Google Cloud, and Azure—provide the infrastructure for serving and managing models in a real-world environment.
Ultimately, the specific tools a team uses come down to their existing tech stack and the unique demands of the project at hand.
At DATA-NIZANT, we provide expert insights to help you master complex data and AI concepts. Explore more articles at https://www.datanizant.com.

