
Here’s the simple difference between confidence level and significance level: confidence level gauges how much trust you can place in an estimate, whereas significance level flags how surprising—or unlikely—a result is under random chance. Picture it like weather reporting: being 95% confident in a sunny day is very different from issuing a tornado warning.
Unpacking The Core Difference

When you’re making data-driven calls, both terms often show up side by side—but they answer different questions. Confidence level asks, “How sure am I about my estimate?” Significance level asks, “How likely is this result just a fluke?”
Balancing those ideas is the key to actionable insight: it helps you decide whether your findings reflect a real pattern or mere noise, so you can act with certainty.
A Practical Example: Website Headlines
Imagine you’re running an A/B test on your site, comparing two headlines:
- Headline A (Control): “Discover Our New Features”
- Headline B (Variation): “Unlock Powerful New Tools Today”
After a week, Headline B gets a slightly higher click-through rate. Great—but is that bump genuine or just luck? Before you roll out the change to all users, you need to know if the result is trustworthy. That’s where confidence and significance step in.
A confidence level tells you how sure you can be about your estimate, while a significance level tells you if your results are likely meaningful beyond chance. Explore more on Statsig.
Defining Their Roles
Confidence Level (1 – α)
- What it does: Builds an interval of plausible values around your estimate.
- Actionable Insight: For Headline B’s click rate, a 95% confidence level might produce an interval of 4.8% to 5.2%. This range gives you a practical forecast of the true performance you can expect if you adopt the new headline.
Significance Level (α)
- What it does: Sets the bar for calling a result “statistically significant.”
- Actionable Insight: You set a threshold, typically α = 0.05 (5%). If your test’s p-value drops below 0.05, you have a green light. This gives you the statistical justification to reject the old headline and confidently implement the new one, knowing the improvement isn't just random.
Before we dive deeper, here’s a quick reference:
Confidence Level vs Significance Level At A Glance
A quick summary table to highlight the fundamental differences between the two core concepts discussed in this article.
| Aspect | Confidence Level (1 – α) | Significance Level (α) |
|---|---|---|
| Primary Question | “How confident am I in my estimate?” | “How likely is this result by chance?” |
| Typical Symbol | 1 – α | α |
| Common Value | 0.95 (95% confidence) | 0.05 (5% significance) |
| Interpretation | Range where the true parameter likely lies | Threshold for rejecting the null |
| Role in Hypothesis Testing | Builds confidence intervals | Determines statistical significance |
This table highlights the core differences at a glance. Keep it handy as we explore each concept in detail.
To go deeper into how these two levels interact in hypothesis testing, check out our detailed guide:
https://datanizant.com/significance-level-and-confidence-level/
What a Confidence Level Actually Tells You

So, what does a 95% confidence level really mean when you're in the trenches with your data? Let's ditch the textbook definitions for a second.
Imagine you're fishing with a big net. The confidence level isn't about how sure you are that you'll catch one specific fish. Instead, it’s a measure of your net's reliability over the long haul. If you cast that net 100 times, a 95% confidence level means you'd expect your net to successfully capture the true fish population parameter in about 95 of those attempts.
It’s all about the consistency of your method—not the certainty of a single outcome. This idea is fundamental to interpreting statistical estimates correctly. It tells you how often you can expect your calculated range to contain the true population parameter if you were to repeat your experiment over and over.
Building the Confidence Interval
At its heart, every confidence interval is made of two simple parts: your best guess and a buffer for uncertainty.
- Point Estimate: This is your best single guess based on your sample. If you survey 50 customers and their average spending is $85, that's your point estimate. Simple as that.
- Margin of Error: This is the "plus-or-minus" value you add to your point estimate. It's the buffer that accounts for the fact that your sample isn't the entire population. A $5 margin of error, for example, would turn your $85 point estimate into a range of $80 to $90.
Put them together, and you get a plausible range where the true average for all your customers likely sits. For a deeper dive into the math behind this, check out our guide on statistical significance and confidence intervals.
The Practical Trade-Off: Certainty vs. Precision
Here's where things get interesting. Choosing a confidence level forces you to make a trade-off between being certain and being precise. There's no single "best" choice; it all depends on the stakes of your decision.
A higher confidence level is like using a wider, more reliable net—you're more certain to capture the true value, but your range is less specific. A lower confidence level gives you a narrower, more precise range, but you accept a greater risk of being wrong.
Let's go back to our customer spending example to see this in action:
- A 99% confidence level might give you a wide interval, something like $75 to $95. You can be very confident the true average is in there, but that's a pretty broad range for making sharp business decisions.
- A 90% confidence level could narrow that down to $82 to $88. This estimate is much more precise, but it comes with a 10% risk that the true average is actually outside that smaller window.
Getting this balance right is critical. For instance, someone using financial forecasting software might be comfortable with a wider interval for a five-year plan but need a much narrower, more precise range for setting next quarter's budget. The confidence level you choose directly shapes the actions you take based on your data.
Making Sense of Significance and P-Values

While a confidence level helps you estimate a range, the significance level is all about making a firm decision. Think of it as the gatekeeper that determines whether your findings are genuinely noteworthy or just a product of random chance.
Let's break this down with a courtroom trial analogy. It makes everything click.
Before any evidence is presented, the legal system establishes a standard of proof, like "beyond a reasonable doubt." This pre-set standard is your significance level, often called alpha (α). It’s a threshold you decide on before you even peek at the data. A common choice for alpha in many fields is 0.05.
Setting the Standard with Alpha
Your significance level, or alpha, is the amount of risk you're willing to take of being wrong in a specific way—making a Type I error. In our trial analogy, this is the risk of convicting an innocent person. It’s the chance of rejecting a true null hypothesis.
By setting your alpha to 0.05, you're essentially saying, "I'm willing to accept a 5% chance that I'll conclude there's a real effect when, in fact, there isn't one." This threshold becomes your line in the sand.
P-Value: The Evidence from Your Data
Once the trial starts, the lawyers bring in the evidence. In statistics, this evidence is your p-value. The p-value is calculated from your sample data and tells you the probability of seeing your results (or something even more extreme) if the initial assumption—the null hypothesis—were actually true.
A small p-value means your data looks very strange under the assumption of "innocence." It’s like finding compelling evidence that points away from the defendant being not guilty.
The Verdict Is Your Decision
Finally, the judge or jury compares the evidence against the standard of proof to reach a verdict. This is where it all comes together.
- If p-value < alpha (e.g., 0.03 < 0.05): The evidence is stronger than your required standard. You reject the null hypothesis and declare the result statistically significant. The verdict is "guilty."
- If p-value ≥ alpha (e.g., 0.12 > 0.05): The evidence doesn't meet your pre-set standard. You fail to reject the null hypothesis. The verdict is "not guilty."
Let's ground this in a business scenario. Say you're testing a new marketing campaign. Your null hypothesis is that the new campaign has zero effect on conversions. You set your alpha to 0.05.
After running the A/B test, you calculate a p-value of 0.02.
Since 0.02 is less than your significance level of 0.05, you reject the null hypothesis. You now have the actionable insight needed to confidently roll out the new campaign, knowing it had a statistically significant impact on conversions.
To get a more complete picture of how all these pieces fit together, check out our guide on statistical significance and confidence intervals. This framework of setting a standard and then evaluating evidence is the core engine of all hypothesis testing.
How Confidence and Significance Work Together
It's tempting to think of confidence level and significance level as separate concepts, but they're really just two sides of the same coin. Think of them as a matched pair; they have a direct, simple mathematical link that's fundamental to all hypothesis testing. Once you grasp this connection, you'll see how estimating a range for your data and making a firm decision are deeply intertwined.
The relationship boils down to one simple formula: Confidence Level = 1 – Significance Level.
So, if you decide on a significance level (often called alpha) of 0.05, your confidence level is automatically 0.95, or 95%. They are complements, always adding up to 100%. The significance level carves out the small, "unlikely" tails of a statistical distribution, while the confidence level represents the large, "likely" area in the middle.
This relationship is perfectly captured in the visual below, which shows how one value directly implies the other.
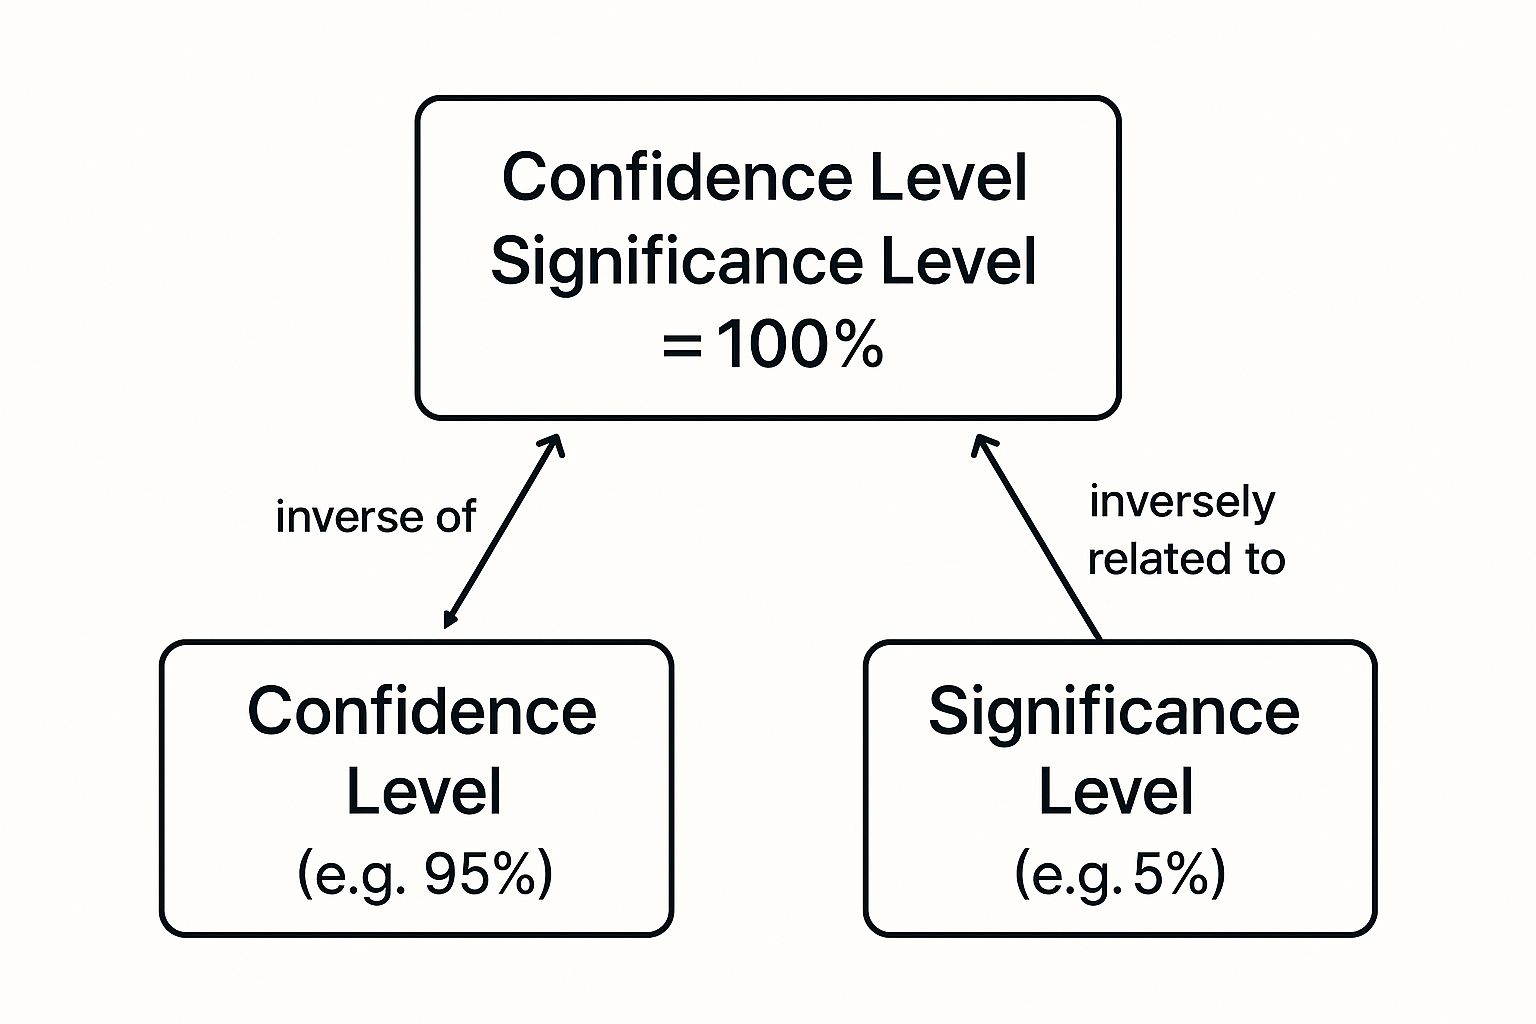
As you can see, a 5% significance level leaves the remaining 95% as the confidence level. They work together to account for all possible outcomes in your test.
A Practical Example Unifying Both Concepts
Let's walk through a single scenario to see how both concepts work in tandem to produce the same conclusion. Imagine an e-commerce company wants to test a redesigned checkout button. Their null hypothesis is that the new button makes no difference to the conversion rate.
-
Hypothesis Test (Using Significance Level): The team sets their significance level (α) to 0.05. After the A/B test, they calculate a p-value of 0.03. Since 0.03 is less than 0.05, they reject the null hypothesis. Actionable Insight: The result is statistically significant—the team has the evidence needed to deploy the new button.
-
Confidence Interval (Using Confidence Level): To see the potential impact, the team then calculates a 95% confidence interval for the change in conversion rate. They find the range is [+0.5%, +4.5%]. Because this entire interval is positive and, crucially, does not include zero (the point of "no effect"), it confirms their earlier finding. Actionable Insight: They can tell stakeholders that the expected lift is likely between 0.5% and 4.5%, providing a clear business case for the change.
Both the hypothesis test and the confidence interval tell the same story. The significant p-value is mirrored by a confidence interval that completely excludes the null value of zero.
Looking at a problem from both angles gives you a much richer understanding than just relying on one method. This dual perspective is especially critical when assessing the reliability of complex financial models, like those built with Monte Carlo simulations, where you need to be sure about your conclusions.
For a deeper dive into how these two concepts interact, check out our complete guide on https://datanizant.com/statistical-significance-and-confidence-intervals/. A solid grasp here ensures your data-driven decisions are both robust and defensible.
Choosing the Right Levels for Your Analysis
It’s easy to fall into the habit of using a 95% confidence level (α = 0.05) as a default for everything. It's the standard in so many textbooks and tutorials, after all. But treating it as a one-size-fits-all rule is a mistake that can lead to some seriously flawed conclusions.
The truth is, picking your confidence and significance levels is a strategic decision. It all comes down to a trade-off: what are you more afraid of?
Are you more worried about a false alarm (a Type I error), where you act on something that turns out to be random noise? Or are you more concerned with missing a genuine discovery (a Type II error)? This balancing act is the core of smart data-driven decision making, because the cost of being wrong should dictate how strict you are with your statistics.
Context is Everything
The "right" levels depend entirely on what’s at stake. A single standard just doesn't work when the consequences of an error can range from trivial to catastrophic.
Let’s look at a couple of examples.
-
High-Stakes Scenarios: Imagine you're running a clinical trial for a new heart medication. A false positive—claiming an ineffective drug actually works—could have fatal consequences. In a situation like this, you need to be incredibly strict. You’d tighten your significance level to something like α = 0.01, which gives you a 99% confidence level. This makes it much harder to approve a useless or harmful treatment by mistake.
-
Low-Stakes Scenarios: Now, think about a simple A/B test for a new ad headline. The cost of a false positive here is pretty low; you might waste a little ad spend on a headline that isn’t actually better. But the cost of missing out on a truly great headline could be significant. Here, you might relax your standards to α = 0.10 (a 90% confidence level) to make sure you don't prematurely dismiss a promising idea.
Your choice of alpha is really a risk management decision. Stricter levels protect you from false positives but make it easier to miss a real effect. Looser levels help you spot weaker signals but increase the risk of chasing ghosts in the data.
So where did the 0.05 standard come from? It's largely a historical convention. Statistical pioneers like Ronald Fisher, Jerzy Neyman, and Egon Pearson saw it as a convenient, middle-of-the-road guideline—not an unbreakable law. Your analysis should be just as flexible, aligning your statistical rigor with the real-world risks of your project.
Common Mistakes and Misconceptions to Avoid
You've grasped the difference between confidence level and significance level—that's a huge step. But this is where the real-world nuance comes in. Subtle misinterpretations can still creep in and lead to some pretty big errors in how you analyze and communicate your findings.
Getting these concepts even slightly wrong can undermine the very data-driven decisions you're trying to make. Let's tackle the most common pitfalls I see all the time.
One of the biggest myths is thinking a 95% confidence interval means there's a 95% probability the true population parameter falls inside that specific range. It feels intuitive, but it’s flat-out wrong.
The 95% actually refers to the long-term success rate of the method you used to create the interval. It has nothing to do with the probability of any single interval you've calculated.
Think of it like a ring toss game at a carnival. If you have a 95% success rate, it means your technique will land the ring on the peg 95 out of 100 times over the long run. But for any single toss you just made, the ring is either on the peg or it isn't—you just don’t know for sure which it is. The probability is 1 or 0, not 95%.
Significance Does Not Equal Importance
Another critical mistake is confusing statistical significance with practical, real-world importance. Just because a result is statistically significant doesn't mean it matters. This trap is especially common when you're working with massive sample sizes, where even tiny, irrelevant differences can produce a low p-value.
For instance, imagine running an A/B test with millions of users. You might find that changing a button color from blue to a slightly different shade of blue increases clicks by 0.01%. Because the sample size is enormous, this result could easily be statistically significant (p < 0.05).
A statistically significant result simply tells you that an effect is unlikely to be due to random chance. It says nothing about the size or practical value of that effect.
So, is a 0.01% lift worth the engineering time and effort to implement? Almost certainly not. This is exactly why you have to look at the effect size—the actual magnitude of the difference—right alongside the p-value. Relying on a simple "significant vs. not significant" mindset is a surefire way to waste resources on trivialities. This is similar to the kind of oversimplification we try to avoid in the bias-variance tradeoff, where a simpler, more practical model can often be better than one that's technically more complex.
Avoiding Common Interpretation Traps
To keep your analysis sharp and your conclusions sound, make sure to steer clear of these common errors:
- Confusing α and p-value: Your significance level (α) is a threshold you decide on before you even start your test. The p-value is a result you calculate from your data. Never, ever change your alpha just because you don't like the p-value you got.
- Assuming non-significance means no effect: Failing to reject the null hypothesis doesn't prove the null is true. It just means you didn’t find enough evidence to say it's false. The effect might be real but too small for your test to detect, or your test might have been underpowered.
- "P-hacking": This is a huge red flag. It’s the shady practice of running test after test, slicing and dicing the data until you finally stumble upon a significant result. This completely invalidates your findings because you're just capitalizing on random chance.
By sidestepping these pitfalls, you can interpret your data with the nuance it deserves. This ensures your insights on confidence and significance levels lead to genuinely smart, impactful decisions.
Common Questions, Answered
Let's tackle some of the most common questions that come up when people are trying to get a handle on confidence levels and significance levels in the real world.
Can I Use a One-Tailed Test Instead of a Two-Tailed Test?
You can, but you have to be very careful. A one-tailed test is only appropriate if you have a rock-solid, directional hypothesis before you even look at the data. For instance, you might be completely certain a new website feature can only improve conversion rates, never hurt them.
When you use a one-tailed test, you're putting all your alpha (say, 0.05) on one side of the distribution. This makes it easier to detect a significant effect in that specific direction. The trade-off? You'll completely miss an effect in the opposite direction. That's why two-tailed tests are generally the safer, more common choice—they let you detect an effect whether it's positive or negative.
What's the Difference Between a Confidence Level and a P-Value?
This is a big one, and it's easy to get them mixed up.
A confidence level is all about estimation. It helps you build a range (the confidence interval) and tells you how much faith you can have in your method for capturing the true population parameter. Think of it as drawing a plausible window around your result.
A p-value, on the other hand, is all about hypothesis testing. It's a direct measurement of the evidence against the null hypothesis, based on your specific sample data. You take your p-value and compare it to your chosen significance level (alpha) to decide whether the evidence is strong enough to reject the null hypothesis.
How Does Sample Size Affect Confidence and Significance?
Sample size is a huge player in all of this. Generally speaking, a larger sample size is your friend.
For confidence intervals, a bigger sample tightens things up. It leads to a narrower confidence interval, shrinking your margin of error and giving you a much more precise estimate of the true population parameter.
When it comes to hypothesis testing, a larger sample size gives you more statistical power. This means you have a much better chance of detecting a real effect if one actually exists, which often translates to a smaller p-value for the same effect size.
At DATA-NIZANT, we love breaking down complex data science and AI topics into clear, actionable insights. Want to sharpen your analytical skills? Explore our in-depth articles.

