
Have you ever built a machine learning model that worked perfectly on your computer, only to see it fail miserably in the real world? This is a classic problem, and the culprit is often how the model was evaluated. Relying on a simple train-test split is like a student cramming for a final exam with just one old practice test. Sure, they might ace that one test, but does it really mean they've mastered the subject? Not necessarily.
Why Your Models Need K-Fold Cross Validation

The single train-test split has a major flaw: its final performance score is completely at the mercy of which data points happen to land in the test set. If you get a "lucky" split where the test data looks a lot like the training data, you'll get an overly optimistic score that doesn't reflect real-world performance. An "unlucky" split, on the other hand, can make a great model look terrible. This leads to an unreliable and unstable evaluation.
This is exactly where k-fold cross-validation comes in. Instead of giving your model one practice test, it’s like giving it multiple, different exams. It systematically uses every single data point for both training and testing, which gives you a much more honest and stable estimate of how your model will actually perform.
The Problem with a Single Split
Let's imagine you're building a model to predict customer churn from a dataset of 100 customers. A typical 80/20 split means you train your model on 80 customers and test it on the remaining 20. The final accuracy score you report is based entirely on how the model performed on that specific group of 20 customers.
This approach introduces two significant problems:
- High Variance: If you shuffle the data and create a new 80/20 split, you'll almost certainly get a different accuracy score. So, which one do you trust? This instability makes it hard to be confident in your results.
- Wasted Data: A full 20% of your valuable customer data is never used to train the model. This is a huge drawback, especially when you're working with smaller datasets where every data point counts.
Adopting a better validation method isn't just a "nice-to-have" technique; it's a foundational skill for anyone serious about building reliable models. It's a core component of any successful data science project.
A More Reliable Evaluation Method
K-fold cross-validation is a statistically robust method for measuring how well a model generalizes to new, unseen data. The technique works by partitioning your entire dataset into k equally sized segments, or "folds." The model is then trained and evaluated k separate times. In each round, one fold is held out as the test set, while the other k-1 folds are used for training.
Before diving into how to implement this, let's quickly compare the two approaches.
Train-Test Split vs K-Fold Cross Validation at a Glance
This table breaks down the key differences between a simple train-test split and k-fold cross-validation.
| Aspect | Simple Train-Test Split | K-Fold Cross Validation |
|---|---|---|
| Data Usage | A portion of data is held out and never used for training (e.g., 20-30%). | All data is used for both training and validation across different folds. |
| Reliability | Prone to high variance; the score depends heavily on the specific random split. | Much more stable and reliable, as it averages results from multiple splits. |
| Performance Metric | Provides a single performance score (e.g., one accuracy number). | Provides a mean performance score and its standard deviation, showing consistency. |
| Computational Cost | Low. The model is trained and evaluated only once. | Higher. The model is trained and evaluated k times. |
| Best For | Very large datasets where the test set is large enough to be representative. | Small to medium-sized datasets or when a highly reliable performance estimate is critical. |
As you can see, while a simple split is faster, k-fold cross-validation provides a far more trustworthy assessment of your model.
Actionable Insight: The magic of k-fold cross-validation is that every single data point gets to be in a test set exactly once. This ensures the model is thoroughly vetted against all parts of the data, leading to a more balanced and dependable performance score. Use it to get a performance range (e.g., 95% +/- 2%) instead of a single, misleading number.
Ultimately, this iterative process smooths out the "luck" associated with any single data split. Instead of a single, potentially misleading score, you get an average performance metric and a standard deviation. This doesn't just tell you the model's expected performance—it also reveals its consistency. That's why k-fold cross-validation is an essential tool in any modern machine learning workflow.
The Mechanics of K-Fold Cross Validation
To really get why k-fold cross-validation is so effective, we need to look under the hood. The whole process is systematic and designed to make sure every single piece of your data gets a turn in the spotlight, which helps give us a much more honest look at how our model is performing. It might sound complicated, but once you break it down, it's actually quite intuitive.
Let's use a practical example. Imagine your dataset contains 100 customer records for an e-commerce site, and you want to predict if a customer will make a repeat purchase. A basic train-test split would set aside 80 records for training and use the remaining 20 for a single test. The final score depends entirely on which 20 customers you happened to pick.
With k-fold cross-validation, we do something much smarter.
The Five Core Steps of the Process
The entire method boils down to five straightforward steps. Let's say we pick a 'k' value of 5. This means we're going to create 5 separate "folds," or groups of customers.
-
Shuffle the Data: The very first thing you do is randomly shuffle your 100 customer records. This is a crucial step. It ensures you don't accidentally introduce bias because of some pre-existing order in the dataset (like customers who signed up first).
-
Split into K Folds: Next, you divide the 100 records into 5 equal folds. In this case, you'd end up with five groups of 20 customers each.
-
Iterate and Train: This is where the real work begins. The process runs for k rounds—5 rounds in our example. In each round:
- One fold (20 customers) is held out as the validation set.
- The other k-1 folds (the remaining 80 customers) are temporarily combined to become the training set.
-
Evaluate Each Fold: At the end of a round, you take the model you just trained and test it against the validation fold that was set aside. You calculate a performance score (like accuracy or AUC) for that round and write it down.
-
Aggregate the Scores: Once all 5 rounds are done, you'll have 5 different performance scores. The last step is to average these scores. This final average gives you a single, much more dependable estimate of how well your model actually performs.
This infographic gives a great visual of how this iterative process works.
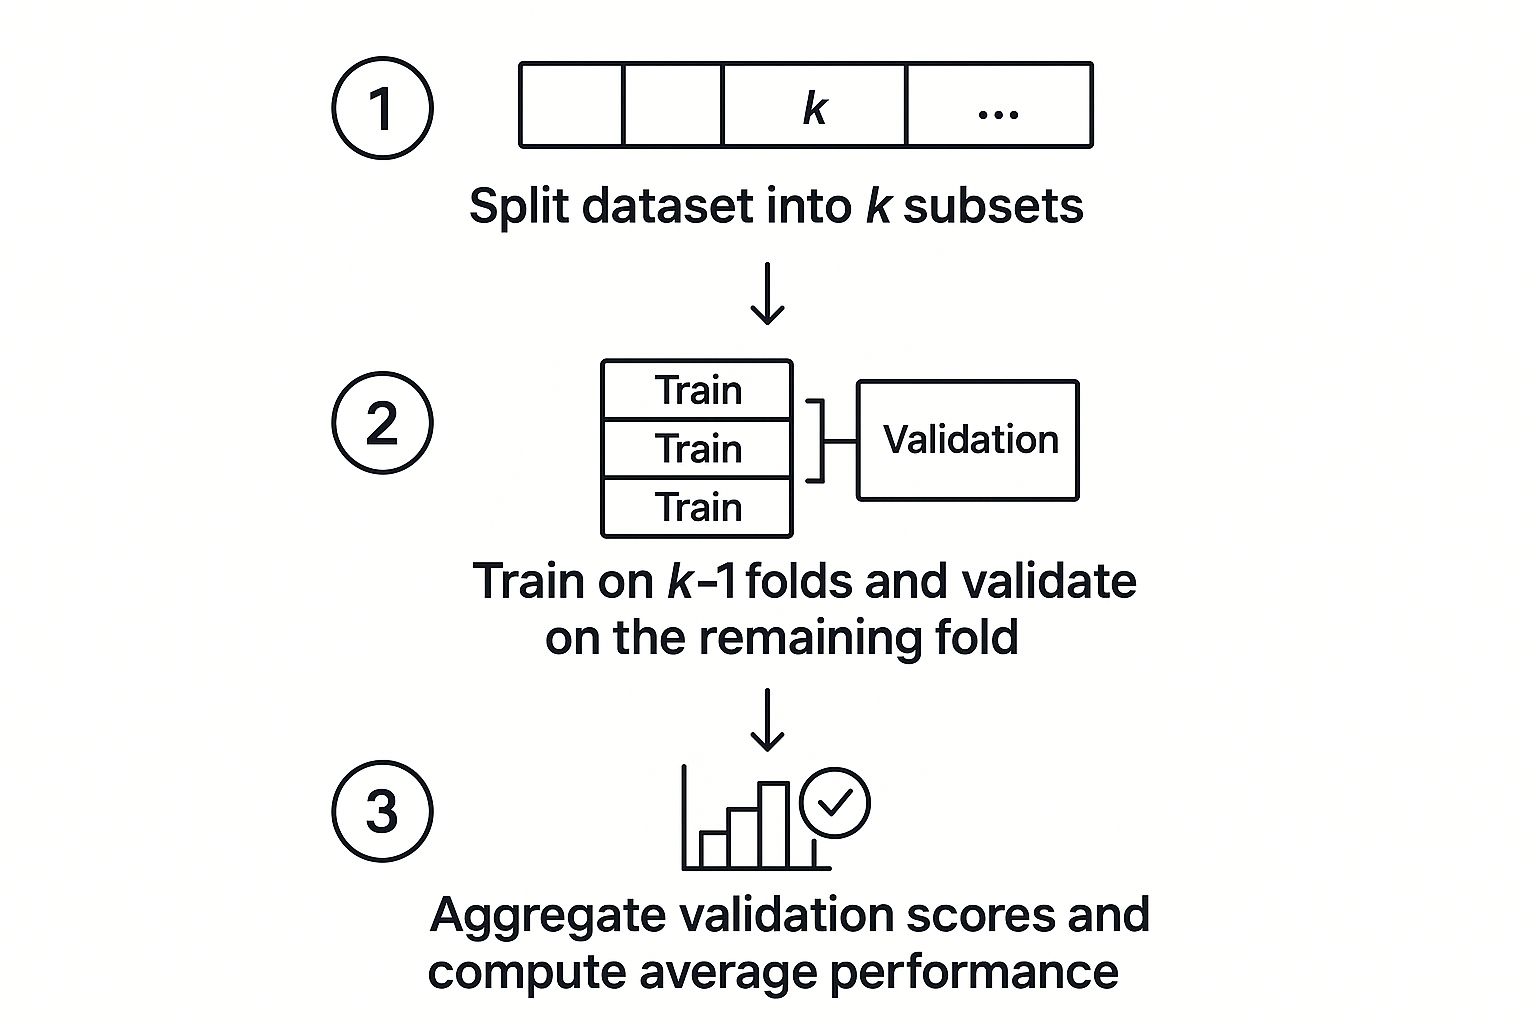
As you can see, the validation set rotates through each part of the data, ensuring nothing gets left out.
Why This Iterative Method Works
The real genius here is in the efficiency and fairness of the method. Every single data point gets to be part of the test set exactly once, and it's used for training k-1 times. This guarantees your model is evaluated on all parts of the data, which dramatically reduces the "luck of the draw" problem you see with a single train-test split.
Actionable Insight: By averaging the results across multiple folds, k-fold cross-validation provides a more stable and less biased estimate of model performance. The resulting mean score is a more trustworthy indicator of how your model will generalize to new, unseen data. Use this mean score to confidently compare different models.
This process also gives you another valuable piece of information: the standard deviation of the scores. This number tells you about the consistency of your model. A low standard deviation means the model performed about the same across all the different folds, which is a sign of stability.
On the other hand, a high standard deviation suggests the model's performance is highly sensitive to the specific data it's trained on—a classic symptom of high variance. To get a better handle on this critical concept, our guide on the bias-variance tradeoff is a great next step. Understanding these mechanics makes the hands-on part, which we'll get to next, feel much more natural.
Implementing K-Fold with Scikit-Learn
Knowing the theory behind k-fold cross-validation is a great start, but the real learning happens when you roll up your sleeves and put it into practice. Thankfully, the de-facto standard for machine learning in Python, Scikit-learn, makes this incredibly easy.
Let's walk through a complete, hands-on example. We won't just dump code on you; we'll explain the why behind each step so you can confidently use k-fold cross-validation in your own projects.

Setting Up the Environment and Data
First things first, we need to import our tools. We'll grab NumPy for number-crunching, KFold and cross_val_score from Scikit-learn to handle the validation, a sample dataset to work with, and a model to test. For this walkthrough, we'll use the classic handwritten digits dataset and a RandomForestClassifier.
# Import necessary libraries
import numpy as np
from sklearn.datasets import load_digits
from sklearn.model_selection import KFold, cross_val_score
from sklearn.ensemble import RandomForestClassifier

# Load the dataset
digits = load_digits()
X = digits.data  # Feature data (pixel values)
y = digits.target # Target data (the digit 0-9)

# Instantiate the model we want to evaluate
# We'll use 50 decision trees in our random forest
model = RandomForestClassifier(n_estimators=50, random_state=42)
This initial setup is bread-and-butter for most machine learning tasks. We've loaded our features (X) and the corresponding labels (y), and we've chosen a RandomForestClassifier to evaluate. The random_state=42 is a small but important detail—it ensures that any randomness in our model is reproducible, so we get the same results every time we run the code.
Executing K-Fold with a Single Function
You could write a manual loop using the KFold object, but why reinvent the wheel? Scikit-learn offers a beautifully efficient function called cross_val_score that does all the heavy lifting for you. This is the most common and practical way to run k-fold CV.
In the background, this single function splits the data, clones your model for each fold, trains it, scores it, and neatly collects the results. It’s that simple.
# 1. Define the cross-validation strategy
# We will use K=10 folds. shuffle=True randomizes the data before splitting.
# random_state ensures the shuffle is the same every time we run it.
kf = KFold(n_splits=10, shuffle=True, random_state=42)

# 2. Run the cross-validation
# This function performs the entire K-fold process automatically.
# It trains and scores the model 10 times.
# 'cv=kf' tells the function to use our defined KFold strategy.
# 'scoring='accuracy'' specifies the metric we want to measure.
scores = cross_val_score(model, X, y, cv=kf, scoring='accuracy')

# 3. Print the results
print(f"Scores for each of the 10 folds: \n{scores}")
With just two key lines of code, we defined our 10-fold strategy and ran the entire validation process. The scores variable is now an array holding ten different accuracy scores—one from each validation run.
Interpreting the Results for Actionable Insight
So, you have an array of ten scores. What now? A list of numbers is useful, but we need to distill it into a single, reportable metric that tells a clear story. The final step is to calculate the mean and standard deviation of these scores.
Actionable Insight: The mean score gives you the model's average expected performance. The standard deviation reveals how much that performance fluctuates. A low standard deviation is a fantastic sign, pointing to a stable and reliable model. If the standard deviation is high, your model is unstable, and you should reconsider your features or model choice.
Let's calculate these final metrics and see what they tell us about our RandomForestClassifier.
# Calculate the mean and standard deviation of the scores
mean_accuracy = np.mean(scores)
std_deviation = np.std(scores)

# Print the final performance summary
print(f"\nMean Accuracy: {mean_accuracy:.4f}")
print(f"Standard Deviation: {std_deviation:.4f}")
print(f"\nModel performance is {mean_accuracy:.2%} ± {std_deviation:.2%}")
Running this might give you a clear, powerful summary like: "Model performance is 97.44% ± 1.55%."
This single statement is leagues more insightful than reporting a one-off accuracy score. It tells us that our model is, on average, about 97.4% accurate, but we can expect its performance to vary by about ±1.55% depending on the specific slice of data it sees. This gives us a robust, trustworthy estimate of how the model will likely perform on new data—which is the entire point of validation.
To see how evaluation fits into the broader picture, check out our guide on the data science project structure over on DataNizant.
Choosing the Right Value for K
Once you've run a k-fold cross validation process, you're inevitably faced with a critical question: how did we pick the number of folds? Choosing the value of 'k' isn't just a random shot in the dark. It’s a crucial decision that directly shapes your model's evaluation, forcing you to balance the accuracy of your performance estimate against the practical costs of computation.
Think of it like choosing a sample size for a political poll. Too small a sample (low 'k'), and your results are unreliable and might not reflect the whole population. Too large a sample (high 'k'), and it becomes prohibitively expensive and time-consuming, while offering diminishing returns in accuracy.
The Bias-Variance Tradeoff in Selecting K
The choice of 'k' is a classic example of the bias-variance tradeoff. Here’s how it breaks down in simple terms:
-
Low K (e.g., k=2 or k=3): When you use fewer folds, each training set is significantly smaller than your full dataset. Models trained on less data are often less powerful, which can introduce a pessimistic bias. Your evaluation might make your model look worse than it really is.
-
High K (e.g., k=N, where N is your sample size): This special case is known as Leave-One-Out Cross-Validation (LOOCV). Here, the training set for each fold contains almost all of your data, leading to a very low-bias estimate. But there's a catch. Because the training sets are so similar, their performance results are highly correlated, which inflates the variance of the final average. It's also incredibly expensive from a computational standpoint.
Actionable Insight: Your goal is to find a 'k' that’s large enough to keep bias low but not so large that it creates excessive variance or brings your machine to a crawl. Start with k=5 or k=10 as a default. If your dataset is huge and computation is slow, try k=3.
Why K=5 and K=10 Are Industry Standards
You’ll see k=5 and k=10 pop up all the time in machine learning projects. These aren't just random numbers—they’ve become the go-to defaults because they consistently strike a good balance between bias and variance for a wide range of problems. Empirical studies have repeatedly shown that 10-fold cross-validation, in particular, offers a great compromise, often yielding a test error estimate with low bias without a huge computational hit.
This doesn't mean they are always the perfect choice, but they are an excellent, reliable starting point. If you're working with massive datasets, even a 10-fold validation can be a serious time sink. In those situations, dropping to a smaller 'k' like 3 or 5 is a practical move to manage the computational load without giving up too much evaluation quality.
Handling Imbalanced Data with Stratified K-Fold
A huge pitfall of standard k-fold cross-validation emerges when you're dealing with classification problems, especially with imbalanced datasets. Imagine you have a fraud detection dataset where 99% of transactions are legitimate and only 1% are fraudulent. A purely random split could easily create a fold with zero fraudulent samples. Trying to test a model on that fold would be completely pointless and misleading.
This is exactly where Stratified K-Fold comes to the rescue.
Stratified K-Fold is a smarter variation that ensures each fold's class distribution is a mirror of the entire dataset. If your overall dataset has a 99/1 split, every single fold created by this method will also have that same 99/1 split. This guarantees your model is trained and tested on a representative slice of all classes in every single iteration.
- Standard K-Fold: Splits data randomly. Risky for classification tasks.
- Stratified K-Fold: Preserves the percentage of samples for each class. Actionable Insight: Make this your default choice for any classification problem to avoid evaluation errors.
To dig deeper into this and other validation nuances, check out our complete guide on k-fold cross validation. Ultimately, choosing the right 'k' is a form of parameter tuning itself, and getting it right sets the stage for everything that follows.
Weighing the Pros and Cons of K-Fold
No single technique in data science is a silver bullet, and that’s especially true for model validation. A seasoned practitioner knows it's not just about how to use a tool like k-fold cross-validation, but more critically, when. This method has some powerful advantages, but it also comes with trade-offs you need to be aware of before you build it into your workflow.

Let’s take a balanced look at the benefits and drawbacks to help you decide if k-fold is the right fit for your project.
The Clear Advantages of K-Fold
The biggest win with k-fold cross-validation is how efficiently and robustly it uses your data. This brings a couple of major benefits to the table.
First, you get a much more reliable performance estimate. A simple train-test split can be a bit of a lottery—you might get a lucky or unlucky split that doesn't represent the real world. K-fold smooths this out by averaging performance across multiple different splits, giving you a score that more faithfully reflects how your model will generalize to new data.
Second, it’s all about efficient data usage. Every single data point gets a turn being in both a training set and a validation set. This is a game-changer when you're working with small datasets. If you only have a few hundred samples, you can't afford to lock away 20-30% of them in a static test set that your model never learns from.
Here's a practical example: imagine you have a medical dataset with just 200 patient records for a rare disease. A standard 80/20 split would leave you training on only 160 records. With 5-fold cross-validation, your model still trains on 160 records at a time, but by the end of the process, it has been validated against every single one of the 200 patients. That’s a far more trustworthy result.
Understanding the Limitations
For all its strengths, k-fold cross-validation isn't a cure-all. It has some real limitations that can make it impractical, or even the wrong choice, for certain problems.
Actionable Insight: The biggest drawback is computational cost. Because you have to train your model 'k' separate times, the process can get slow, fast. Before committing to k-fold CV, run a single training instance to estimate the time. If it takes hours, using k-fold may be impractical.
Training a simple logistic regression model 10 times is no big deal. But try that with a deep learning model like a Transformer, where a single training run could take hours or even days. Suddenly, 10-fold CV becomes computationally prohibitive.
Beyond the time sink, there are a couple of other critical weaknesses:
- Not for Time-Series Data: The random shuffling in standard k-fold completely scrambles the chronological order of time-series data. This leads to data leakage, as you'd effectively be using the future to predict the past—a cardinal sin in forecasting. For time-series, use methods like TimeSeriesSplit in Scikit-learn.
- Fails with Imbalanced Datasets: As we’ve covered, vanilla k-fold can accidentally create folds that don't represent the class distributions in your data. For these classification tasks, a smarter variant like Stratified K-Fold isn't just nice to have; it's necessary.
Thinking through these trade-offs is core to solid model evaluation. For a refresher on the principles behind these ideas, exploring some basic statistics concepts can add valuable clarity. Knowing when to use k-fold—and when to leave it on the shelf—is what separates a good data scientist from a great one.
Pros and Cons of K-Fold Cross Validation
To help you decide, here’s a quick summary of the key benefits and drawbacks of using k-fold cross-validation for your project.
| Advantages | Limitations |
|---|---|
| More Reliable Metrics: Averages results over 'k' folds for a stable performance estimate. | High Computational Cost: Requires training the model 'k' times, which can be very slow. |
| Efficient Data Use: Every data point is used for both training and validation. | Unsuitable for Time-Series Data: Random shuffling breaks the temporal order, causing data leakage. |
| Ideal for Small Datasets: Maximizes the use of limited data, unlike a single train-test split. | Can Fail on Imbalanced Data: Standard k-fold may create folds with skewed class distributions. |
| Reduces Sampling Bias: Minimizes the "luck of the draw" from a single, random data split. | Complexity in Implementation: More complex to set up and manage than a simple train-test split. |
Ultimately, choosing k-fold cross-validation is a strategic decision. It offers a robust way to validate your model, but you have to weigh that against the time and computational resources you have available.
Common Questions About K-Fold Cross Validation
As you start working with k-fold cross-validation, a few key questions almost always pop up. Getting these straight is crucial for using the technique properly and actually trusting your results. Let's walk through some of the most common points of confusion.
Is the Final Model Trained During K-Fold Cross Validation?
This is a big one, and the answer is a firm No.
Think of k-fold cross-validation as an audition process. Its entire job is to evaluate a model's potential—how well a specific algorithm with a certain set of hyperparameters will likely perform on data it's never seen before. It’s a method for picking the best candidate.
Actionable Insight: Once you’ve used cross-validation to find your winning model and its best settings (e.g., a Random Forest with 100 trees), you must then train that chosen configuration one last time on the entire training dataset. This final step ensures your model learns from every possible example before you deploy it.
When Should I Use Stratified K-Fold?
Honestly, for any classification problem, you should make Stratified K-Fold your go-to method.
With standard k-fold, the random shuffling can sometimes lead to bad luck. You might get a fold where a minority class is barely represented or, in the worst case, completely absent. This can throw your evaluation way off.
Actionable Insight: Stratified K-Fold solves this by making sure each fold's class balance perfectly reflects the overall dataset. To implement it, simply use
StratifiedKFoldfrom Scikit-learn instead ofKFold, or even better, just pass your fullyvector to thecvparameter incross_val_scorewhen doing classification, and Scikit-learn often defaults to stratified splits.
Can I Use K-Fold for Hyperparameter Tuning?
Absolutely, and it's one of the most powerful ways to use it. However, you have to be careful to avoid a sneaky problem called data leakage. The gold standard for this is a method called nested cross-validation.
Here’s the practical approach:
- The Outer Loop: This is a standard k-fold split. Its only job is to provide a final, unbiased evaluation of your entire tuning process. The test set in each outer fold is kept completely separate and untouched.
- The Inner Loop: For each training split created by the outer loop, you run another k-fold process. This inner loop is where you perform the hyperparameter search (for example, using Scikit-learn's
GridSearchCVorRandomizedSearchCV) to find the best settings.
This two-level structure ensures that the hyperparameter tuning happens without ever peeking at the outer loop's test data. It gives you a true, unbiased score for how well your tuning strategy generalizes.
Of course, once you've tuned and deployed your model, the work isn't over. You need to implement machine learning model monitoring to make sure its performance doesn't degrade over time. This ongoing vigilance is key to keeping a model effective as the world and the data change.

