
So, what exactly are data science insights?
They're the actionable truths hiding in plain sight within your data—the kind of truths that fuel smart, confident business decisions. It’s about making the critical shift from just passively collecting information to actively using it as a competitive edge. These aren't just statistics; they're the clear, strategic directions that surface when you properly analyze complex datasets, leading directly to a specific action you can take.
From Data Overload to Strategic Advantage

Let's be honest: many businesses today are drowning in data but starving for wisdom. You're gathering massive amounts of information—sales figures, customer interactions, market trends—but turning that raw material into a clear path forward is a huge hurdle. This is precisely where the power of data science comes in to deliver actionable insights.
Think of your data scientist as a detective and your dataset as a sprawling crime scene full of clues. A novice might just report the facts: "Sales in the Northeast are down 15%." But a real detective connects the clues to tell a story that demands action. They discover that the sales drop is linked to a recent competitor's marketing campaign targeting a specific demographic. The actionable insight isn't just that sales are down, but that a targeted counter-offer to that demographic could win customers back. As we explore in our guide on data science for business, this shift from reporting to recommending is everything.
Shifting from Reporting to Action
The whole point is to move from simply having data to using it as your number one strategic asset. This requires a fundamental change in how you think. Instead of asking, "What does our data show?" you start asking, "What should our data tell us to do next?"
Making this shift unlocks incredible potential. Here’s what that looks like in the real world:
- From Passive to Proactive: Rather than just reacting to last quarter's sales numbers, you can now predict which customers are about to churn and step in before they walk away with a targeted retention offer.
- From Guesswork to Guidance: Instead of launching a marketing campaign on a hunch, you can pinpoint the exact customer segments most likely to respond to a 20% discount versus a free shipping offer.
- From Confusion to Clarity: No more getting overwhelmed by conflicting metrics. You can finally identify the key drivers of business growth with confidence and focus your budget there.
For a great practical look at making this shift in a complex industry, check out this guide: From Data Overload To Actionable Insights: How BIAS Simplifies Banking Intelligence.
A true data science insight doesn't just inform; it compels action. It's the bridge between raw data and measurable business impact, turning numbers into a clear, decisive strategy.
Ultimately, it all comes down to unlocking the powerful narratives hidden inside your information. This guide will give you the framework and tools to stop being a passive data collector and start building a real competitive advantage.
The Three Pillars of Powerful Insights
To get real value from your data, you have to know what kind of questions to ask. It’s not about running a single analysis; it’s about a journey that takes you from raw information to smart, decisive action.
This process unfolds across three stages, each building on the last. Think of it as moving from hindsight to foresight, and ultimately, using that foresight to gain a serious competitive edge.
Pillar 1: Descriptive Analytics — What Happened?
The first and most fundamental step is Descriptive Analytics. This is your rearview mirror. Its sole purpose is to comb through historical data and tell you exactly what has already happened in your business. It answers the simple but critical question: "What happened?"
This is where you'll find your dashboards, reports, and visualizations. They pull together data from sales records, website traffic, and customer interactions to give you a clear picture of the past. It won't tell you why something happened, but it provides the essential context for any deeper analysis.
Practical Example:
An e-commerce store's dashboard shows that cart abandonment rates spiked by 30% last week. That's it—a clear, factual summary of a past event. It’s the kind of insight that immediately begs the next question, but it doesn't yet tell you what to do.
Pillar 2: Predictive Analytics — What Could Happen?
Once you know what happened, the natural next step is to figure out what's likely to happen next. This is where Predictive Analytics comes in, acting as your forward-looking radar. Using machine learning and statistical modeling, it sifts through historical data to find patterns and forecast future outcomes.
It answers the crucial question: "What could happen?"
This is where data science starts to feel like a superpower. Instead of just reacting to events, you can start anticipating them. This pillar is the engine behind everything from weather forecasts to stock market predictions.
Predictive analytics is the bridge between knowing your history and preparing for your future. It turns patterns from the past into a probable roadmap of what's to come, giving you the chance to act proactively.
Practical Example:
Following the cart abandonment spike, the data science team builds a model. It analyzes user behavior and predicts that customers who spend more than three minutes on the shipping page without completing checkout have a 90% probability of abandoning their cart. This is a predictive insight.
Pillar 3: Prescriptive Analytics — What Should We Do?
The final and most advanced stage is Prescriptive Analytics. If predictive analytics is the forecast, prescriptive analytics is your strategic advisor telling you what to do about it. It moves beyond just describing the past or predicting the future to recommend specific actions to achieve a goal.
It answers the ultimate business question: "What should we do about it?"
This is where complex algorithms come into play, simulating different scenarios to pinpoint the best course of action. It takes the predictions from the previous stage and connects them to concrete, actionable steps.
The infographic below shows how this entire process works, turning messy, raw data into the kind of clean insights that fuel smart decisions.
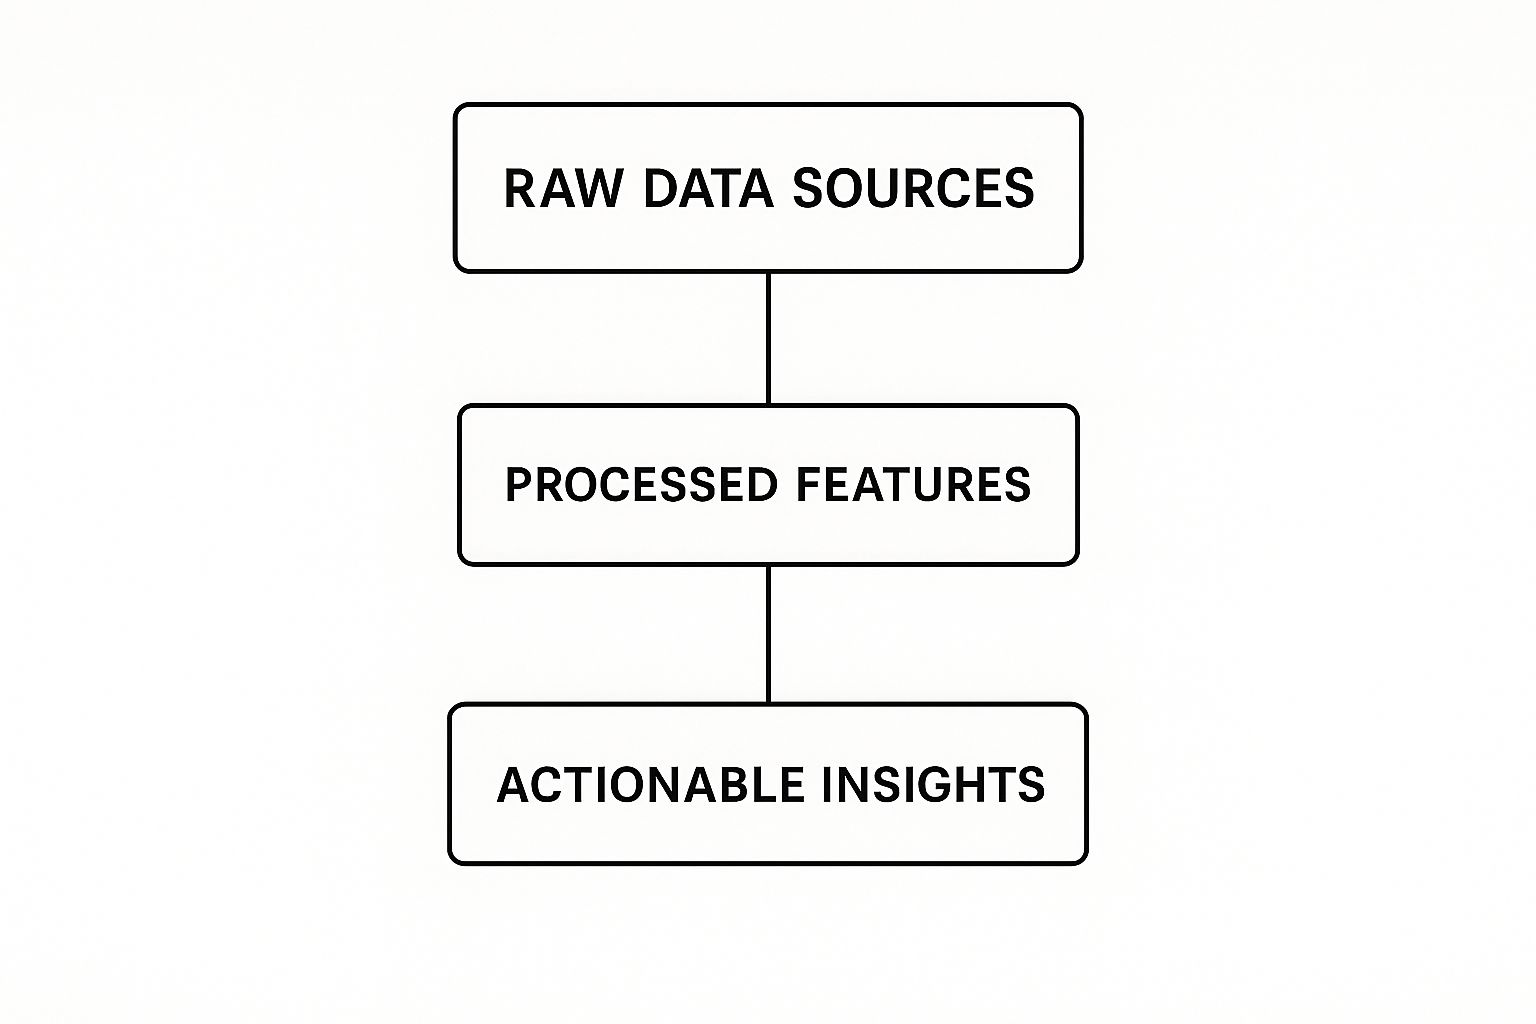
This workflow is the backbone of modern data strategy, showing a clear path from data chaos to clarity.
Practical Example:
The e-commerce store now uses its predictive model to trigger an action. The prescriptive system recommends a specific intervention: when a user is identified as high-risk (lingering on the shipping page), automatically trigger a pop-up offering free shipping. This is the final, actionable insight that directly solves the business problem.
Before we explore these analytics types further, let's break down how they differ and the unique value each one brings to the table.
The Evolution of Data Analytics for Actionable Insights
This table outlines the progression from understanding past events to shaping future outcomes.
| Analytics Type | Core Question | Common Techniques | Business Outcome |
|---|---|---|---|
| Descriptive | What happened? | Dashboards, Reporting, Data Aggregation | Hindsight: A clear view of past performance. |
| Predictive | What could happen? | Machine Learning, Statistical Modeling, Forecasting | Insight: The ability to anticipate future trends and behaviors. |
| Prescriptive | What should we do? | Optimization, Simulation, A/B Testing, AI | Foresight: Data-driven recommendations for optimal actions. |
Mastering this progression is what separates companies that simply have data from those that use data to win.
As the world churns out more data—an estimated 181 zettabytes by 2025—the need to navigate these pillars becomes urgent. It’s no surprise that 80% of enterprise leaders agree that better data access helps them make faster decisions. Getting a handle on these analytical stages isn't just a technical exercise; it's a core business strategy.
Finding Actionable Insights in Your Data
Knowing the different types of analytics is a great start, but the real magic happens when you roll up your sleeves and unearth your own data science insights. Getting from theory to practice isn’t about some complex technical wizardry; it’s more like a four-step mission to turn raw information into a clear, strategic advantage.
This whole process shifts your role from someone who just looks at data to someone who actively hunts for insights. Each step logically builds on the last, giving you a repeatable workflow that blends powerful tools with good old-fashioned human intuition. Let's break down this mission.
Step 1: Define a Sharp Business Question
Every worthwhile data science project starts with a question, not a dataset. A fuzzy goal like "increase sales" is just too broad to get you anywhere. You need a sharp, specific question to guide your entire investigation.
Think of a well-defined question as your compass—it keeps you from getting lost in a sea of endless data. It gives you focus, helps you define what success looks like, and makes sure the insights you find are actually relevant to a real business problem. Without that clarity, you're just shooting in the dark.
Practical Example:
Instead of "increase sales," a subscription-based business might ask: "Which customer actions in the first 7 days of a free trial are the strongest predictors of conversion to a paid plan?" This question is measurable, specific, and tied directly to an action—encouraging new users to perform those key actions.
Step 2: Explore and Visualize Your Data
Once you have your question, it's time to put on your detective hat. This phase is all about exploratory data analysis (EDA), where you dive into your datasets looking for patterns, oddities, and outliers. And your best tool for the job? Data visualization.
Trying to spot trends in a raw spreadsheet is nearly impossible. But when you visualize that same data with charts, graphs, and heatmaps, those patterns jump right out. You’re essentially looking for the "unusual"—the unexpected spikes, dips, or clusters that hint at a deeper story. This step is less about finding final answers and more about generating your first educated guesses.
The goal of exploration isn't to conclude, but to question. It's about letting the data surprise you and using those surprises to form hypotheses about what's really going on.
Step 3: Form and Test Your Hypothesis
Your exploration will probably spark a few "aha!" moments. Maybe you notice that customers from a particular city are canceling their subscriptions at a much higher rate. That observation is the seed of a hypothesis: "Customers in the Midwest are churning because our service has higher latency in that region."
Now, you have to test that suspicion with a more rigorous analysis. This could mean isolating variables, running statistical tests, or setting up A/B tests to see if your hypothesis holds up. This step is critical because it separates correlation from causation, making sure your conclusions are built on solid evidence, not just a coincidence. This methodical approach is a cornerstone of effective data-driven decision-making.
Step 4: Apply Machine Learning Models
With a validated hypothesis, you can bring in machine learning models to scale your findings and start making predictions. For instance, you could use a clustering algorithm to automatically segment all your customers based on their behavior, not just their location. This might uncover several distinct "at-risk" groups, each churning for different reasons.
Practical Example:
A streaming service uses this process. They discover a segment of users who always cancel right after their favorite show's season finale airs. The insight isn't just "people cancel"; it's a specific, actionable discovery. The actionable insight is to create a system that automatically emails these specific users with recommendations for a similar show just before their current one ends. This turns a data point into a proactive retention strategy.
Don't forget that external data sources, like customer feedback, are goldmines for generating these kinds of insights. Learning how to gather effective customer feedback can add a whole new dimension to your analysis. When you combine powerful models with diverse data and deep domain knowledge, you can elevate a simple observation into a game-changing business strategy.
Real-World Examples of Data Science in Action
Frameworks and theories are great, but the real magic happens when you see data science insights deliver tangible results. To really connect the dots between concept and impact, let's walk through a few mini-stories from different industries. Each one will break down a specific business problem, the data science solution, and the bottom-line outcome.
These aren’t just abstract ideas. They're real scenarios where data became a game-changing advantage. From streamlining logistics to improving patient care, the applications are as diverse as they are powerful.
Optimizing Logistics with Prescriptive Analytics
A major logistics company had a classic, high-stakes problem: fuel costs were absolutely demolishing their profit margins. With thousands of trucks on the road daily, even a tiny improvement in route efficiency could mean millions in savings. The real challenge was the sheer complexity of it all—factoring in traffic, delivery windows, truck capacity, and fuel consumption made optimal routing a nightmare.
The Data Science Approach:
The company went beyond basic route-planning software and built a prescriptive analytics model. This system didn't just predict traffic; it simulated thousands of route combinations on the fly to recommend the absolute best path for every driver.
- Data Inputs: The model consumed a massive stream of data, including live GPS feeds, historical traffic data, weather forecasts, and even vehicle maintenance schedules.
- The Actionable Insight: The breakthrough discovery was that the shortest route was almost never the most fuel-efficient. The model found that slightly longer routes that avoided steep hills or constant stop-and-go traffic led to huge fuel savings. The actionable insight was to reroute trucks based on fuel efficiency, not just distance.
- The Impact: By adopting the model's recommendations, the company cut its annual fuel use by over 10%, saving an estimated $50 million in the first year alone.
This is a perfect illustration of how the entire data science lifecycle—from gathering data to deploying a working model—comes together to solve a concrete business problem.
Identifying At-Risk Patients with Predictive Models
In healthcare, catching a problem early can change everything. A large hospital network wanted to get ahead of chronic conditions like diabetes and heart disease by proactively identifying high-risk patients. If they could spot these individuals sooner, they could offer preventative care and lifestyle coaching, improving lives while lowering long-term treatment costs.
The Data Science Approach:
The hospital’s data science team developed a predictive model using years of historical patient data. The goal was simple: create a "risk score" for every patient to flag those who needed a closer look.
By applying machine learning to electronic health records, data scientists could uncover subtle patterns that even experienced doctors might miss, creating a powerful early-warning system.
The model sifted through hundreds of variables—lab results, family history, prescriptions, and demographic info. The key actionable insight was that a combination of minor risk factors (like slightly elevated blood pressure plus infrequent check-ups), when viewed together, was a surprisingly strong predictor of a future cardiac event. The action was to automatically flag these patients for a follow-up call from a nurse practitioner to schedule a preventative screening.
By putting this predictive system into practice, the hospital identified 20% more at-risk patients than they did with traditional screening methods, allowing for earlier, more effective interventions.
Stopping Financial Fraud with Anomaly Detection
A fast-growing fintech company was getting hammered by a rise in fraudulent transactions. Their old, rule-based fraud systems just couldn't keep up with clever fraudsters who were constantly changing their game. They needed a smarter, more adaptive way to protect customers without hassling legitimate users with false alarms.
The Data Science Approach:
They turned to an anomaly detection model, a type of machine learning that’s brilliant at spotting outliers. Instead of relying on a rigid list of "fraud rules," the model first learned what "normal" looked like for each customer.
It churned through millions of transactions to build a unique profile of typical spending habits, locations, and timings for every user. Any transaction that strayed too far from a user's known pattern was instantly flagged for review. The actionable insight wasn't just "this looks weird," but "this transaction is a 95% match for a known fraud pattern involving gift card purchases." This specificity allowed the system to automatically block high-risk transactions while sending a simple verification text for moderately risky ones.
The impact was huge. The new system slashed successful fraudulent transactions by 65% and, just as importantly, reduced the number of legitimate purchases that were incorrectly declined. This didn't just save the company millions; it built serious trust with its customers.
Building a Team That Delivers Powerful Insights

Algorithms are fantastic tools, but they don't create business value out of thin air. People do. The secret to consistently generating powerful data science insights isn't just about the tech—it's about the humans behind it. Investing in the right platforms is a given, but it’s the skilled, collaborative team you build that truly transforms raw data into a strategic advantage.
A modern data team isn't just a collection of smart people with impressive job titles. It’s a carefully assembled mix of specialized technical experts and sharp business minds. Simply filling seats won't cut it; what matters is how these distinct roles and skill sets mesh together to solve real-world problems.
The Core Roles of a Modern Data Team
A high-performing data science unit is like a well-oiled machine with several key players, each bringing a unique piece of the puzzle to the table. While the titles might shift from company to company, their functions are essential for a smooth workflow that takes you all the way from raw data to actionable recommendations.
Here are the essential roles you need on your roster:
- Data Engineers: Think of them as the architects and plumbers of your data world. They build and maintain the pipelines that collect, store, and process massive datasets, making sure everything is clean, reliable, and ready for analysis.
- Data Analysts: These are the storytellers who work with structured data. They dive into databases to answer specific business questions, then build dashboards and visualizations that make it easy to track performance and spot emerging trends.
- Data Scientists: This role is the bridge between analysis and prediction. Data scientists use statistical methods and machine learning models to uncover deeper patterns and forecast what’s coming next.
- Machine Learning Engineers: When a predictive model is ready to go live, these are the folks who make it happen. They specialize in taking machine learning models out of the lab and into production, ensuring they run efficiently and reliably within your business applications.
A common pitfall is trying to find a single person who can do it all. Real success comes from fostering collaboration between these specialists, where each role empowers the others to do their best work.
Bringing the Team Together for Actionable Insight
So, what does this team dynamic look like in practice? Let's say an e-commerce company wants to figure out why customers are leaving and how to stop it. This isn’t a task for one person—it’s a mission for the whole team.
A Practical Example:
- The Data Engineer kicks things off. They build a pipeline to pull customer data from all over the place—purchase history, website clicks, support tickets—and consolidate it into a single, clean dataset.
- Next, the Data Analyst digs in to find initial trends. They discover that customers who haven't bought anything in 90 days and have low website engagement are the most likely to churn.
- With this insight in hand, the Data Scientist builds a machine learning model to predict the churn risk for every single customer, updating it in real time.
- Finally, the Machine Learning Engineer takes that model and deploys it into the company’s marketing automation system. Now, the system can automatically trigger retention campaigns for customers who are flagged as high-risk.
This kind of seamless collaboration is where the magic happens, but managing these complex workflows is a skill in itself. Our guide on data science project management offers a deeper dive into orchestrating these efforts effectively.
The demand for these professionals is exploding. Between 2020 and 2022, the need for data scientists jumped by roughly 56%, with job postings showing that about 77% require machine learning skills. As a result, average entry-level salaries are projected to hit around $152,000 in 2025. You can find more details on the data scientist job outlook on 365datascience.com.
Assembling a team that can deliver these kinds of insights isn’t just an operational task—it’s one of the most critical business investments you can make.
Putting Your Data Science Insights into Action
An insight, no matter how brilliant, is just a piece of trivia until it drives a decision or sparks change. The final, most crucial step in the data science journey is turning your discoveries into tangible business outcomes. It’s about building a bridge from your analytical findings to real-world operational improvements.
This all starts with effective communication. You can't just drop a spreadsheet full of numbers on someone's desk and expect them to get it. You need to tell a compelling story. Data storytelling is the art of framing your insight within a business context—explaining the problem, revealing your findings, and clearly recommending a course of action. This narrative approach is what wins over stakeholders and builds momentum for change.
From Analysis to Automation
The real goal here is to embed your data science insights directly into the company’s daily workflows. Instead of creating one-off reports that get filed away and quickly become outdated, the focus should be on building sustainable systems that deliver continuous value.
A practical way to do this is by creating intuitive dashboards. These tools don’t just display data; they monitor key performance indicators (KPIs) in real time and can even send automated alerts when metrics drift off course. For instance, a retail company might use a dashboard to track inventory levels, automatically flagging items at risk of selling out before it becomes a problem.
The most powerful insights are those that lead to smarter, automated decisions. The objective is not just to inform human choices but to build systems that can act on data intelligently without constant manual intervention.
To make sure your actions are actually making a difference, it's best to adopt an iterative cycle of improvement. This framework keeps your efforts grounded in measurable results and fosters a culture where the team is always learning.
- Act: Implement a change based on your insight.
- Measure: Track the impact of that change using clear, agreed-upon metrics.
- Learn: Analyze the results to see if your hypothesis was correct. What really happened?
- Refine: Adjust your approach based on what you learned and repeat the cycle.
A Practical Example of Implementation
Let's make this concrete. Imagine an e-commerce business discovers through its analysis that customers who use the on-site search bar are three times more likely to make a purchase.
- The Insight: The search function isn't just a feature; it's a critical, high-conversion tool.
- The Action: The team decides to make the search bar more prominent on the homepage and improve its autocomplete suggestions to make it even easier to use.
- The Measurement: They track the conversion rate of users who interact with the new-and-improved search bar over the next two weeks using an A/B test.
- The Learning: The changes result in a 15% increase in conversions from search users. A clear win.
- The Refinement: Now that they know how valuable search is, the next actionable step is to test personalized search results based on a user's browsing history to see if they can increase conversions even more.
This simple loop turns a single data point into an ongoing engine for business growth. To continue your own journey, explore Datanizant's other guides on specific data science applications.
Frequently Asked Questions About Data Science
Jumping into data science can feel like opening a Pandora's box of questions. To help you find your footing, we've gathered some of the most common ones we hear and provided straightforward answers to clear things up.
What Is the Difference Between Data Science and Business Intelligence?
Think of it this way: Business Intelligence (BI) is like looking in your car's rearview mirror, while data science is your GPS navigator.
BI is fantastic at showing you what's already happened. It uses descriptive analytics to create dashboards and reports, like summarizing last quarter's sales figures. It’s all about monitoring and reporting on the past.
Data science, on the other hand, is focused on the road ahead. It uses predictive and prescriptive models to forecast what's likely to happen and suggest the best way forward. While BI tells you that customer churn increased by 5%, data science builds a model that identifies at-risk customers in real-time and recommends sending them a personalized discount to prevent them from leaving.
How Can a Small Business Start with Data Science?
You don’t need a massive budget or a team of PhDs to get real value from data science. The secret is to start small and focus on a specific, nagging business problem. Don't try to solve everything at once.
- Ask a Sharp Question: Instead of a vague goal like "How can we use data?" get specific. Ask something like, "Which of our marketing channels brings in the customers who spend the most over time?"
- Use the Tools You Have: You can get surprisingly far with tools you probably already use. Dive into Google Analytics or even the advanced features of your spreadsheet software to start exploring.
- Pick One Project: Run a small, focused experiment. For example, analyze your customer purchase history to find which products are most often bought together. The actionable insight? Create product bundles with those items to increase the average order value. A quick win here builds the confidence and momentum you need for bigger projects.
Is Data Science Just About Algorithms and Coding?
Not even close. While technical chops in languages like Python or SQL are definitely part of the job, the real magic comes from curiosity and a solid understanding of the business. An algorithm is great at spotting a pattern, but it takes a human to ask why that pattern exists and how to turn it into a smart decision.
Practical Example: A model finds a strong correlation between ice cream sales and crime rates. A coder might just report the finding. But a true data scientist applies business context and realizes this is a classic "lurking variable" case—hot weather causes both. The actionable insight is not to hire more police to sell ice cream, but perhaps to increase marketing for ice cream during heatwaves. It's that blend of technical skill and critical, real-world thinking that creates genuine value.
How Do You Ensure Data Science Is Ethical and Governed?
This is one of the most important questions in the field today. An insight is worse than useless if it’s built on biased data or used irresponsibly. Without strong governance, you risk eroding customer trust and making unfair decisions.
An effective AI governance framework isn't just a compliance checkbox; it's a strategic imperative that builds trust with customers and ensures your data-driven decisions are fair and transparent.
Laying down clear rules for data access, model transparency, and fairness audits is non-negotiable. For example, a loan approval model must be tested to ensure it doesn't unfairly discriminate against applicants based on protected attributes. To put a solid system in place, check out our guide on creating a practical AI governance framework. It will help you make sure your insights are not only powerful but also principled.
Ready to build a data-driven culture? At DATA-NIZANT, we provide the expert analysis and in-depth articles you need to turn information into a strategic advantage. Explore our guides and start your journey today at https://www.datanizant.com.

