
Anomaly detection techniques are the tools we use to find the odd ones out in a sea of data. They’re designed to spot rare items, events, or observations that just don't fit in with everything else.
Think of these techniques as a seasoned security guard who has walked the same beat for years. They know the building's normal rhythm—the hum of the servers, the faint creak of a specific floorboard, the exact shadow a plant casts at dusk. They don't need a checklist; their deep, almost intuitive familiarity lets them instantly notice when something is off. A faint, unfamiliar noise? A door left ajar that's always locked? That's what gets their attention. Anomaly detection works on the same principle, but for your data.
What Is Anomaly Detection Really About
These techniques are your digital guards, meticulously learning the normal pulse of your business. Their entire job is to pinpoint the rare events and outliers that break from this established pattern, whether it's a fraudulent transaction, a network breach, or a failing piece of machinery.
For a deeper dive into this core idea, check out our introductory guide on what anomaly detection is.
Anomaly detection is the process of identifying data points, events, or patterns that deviate from a dataset's expected behavior. It's the core of modern fraud detection, cybersecurity, and predictive maintenance systems.
The Three Faces of Anomalies
Before you can pick the right tool for the job, you have to know what you're looking for. Anomalies usually show up in one of three forms, and each requires a slightly different way of thinking to be spotted.
- Point Anomalies: This is the most straightforward type. It’s a single data point that is glaringly different from everything else. A classic example is a credit card transaction for $10,000 when the cardholder’s average spend is just $50. It sticks out like a sore thumb.
- Contextual Anomalies: These are sneakier. A data point might look perfectly normal on its own, but it becomes strange when you consider its context. For instance, someone buying a heavy winter coat is completely normal in December. But that same purchase in the middle of July? That's a contextual anomaly.
- Collective Anomalies: This kind of anomaly isn't about a single data point, but a group of them that, together, signal something is wrong. A single failed login attempt is no big deal. But a rapid-fire series of 100 failed attempts from the same IP address in under a minute? That’s a clear signature of a brute-force attack.
Why It Is So Critical
Getting a handle on these distinctions is more than just academic—it directly shapes which anomaly detection techniques will actually work. A simple statistical check might easily flag a point anomaly, but catching a collective one often requires more sophisticated methods that can recognize patterns developing over time.
These digital guards are absolutely essential for protecting modern systems. They are the first line of defense in:
- Stopping financial fraud by flagging irregular transactions in real-time.
- Securing networks by identifying unusual traffic that could signal a breach.
- Preventing system failures by detecting the early warning signs of malfunction in industrial equipment.
By mastering how to identify these different types of outliers, businesses can shift from a reactive to a proactive stance. This sets the stage perfectly for the powerful statistical, machine learning, and deep learning methods we're about to explore.
The Evolution of Finding Outliers
To really get a feel for today's sophisticated AI-driven systems, it helps to take a trip back in time. The idea of spotting outliers didn't start in a climate-controlled server room; it began on the factory floor, long before the first computer was even a blueprint. The story of modern anomaly detection techniques is rooted in manufacturing.

From Assembly Lines to Algorithms
Back in the 1930s, quality control was everything. Factories desperately needed a consistent way to make sure every single product rolling off the line met strict standards. This challenge gave rise to statistical process control (SPC), the earliest ancestor of systematic anomaly detection. These methods were the first "digital guards" for quality, using simple but powerful statistical rules.
The core principle was to define a range of what's "normal." For instance, a widely adopted rule considered any measurement falling more than 3 standard deviations (σ) from the average (µ) to be an anomaly. Statistically speaking, this µ ± 3σ range accounts for about 99.7% of all expected results. Anything outside it had only a 0.3% chance of being normal, making it a likely defect. This simple idea was a massive first step in using data to find exceptions. You can explore the full history and see how these early statistical ideas evolved.
For its time, this statistical approach was a game-changer. It gave quality checks a clear, mathematical backbone that was perfect for the predictable world of an assembly line.
The Rise of Rule-Based Systems
As technology marched on, the problems became more complex. Industries like telecommunications and early cybersecurity started facing new kinds of threats, from billing fraud to hackers trying to gain network access. The answer? Rule-based systems.
Think of a detailed playbook written by a seasoned security expert. That's a rule-based system in a nutshell. It's a collection of hand-coded "if-then" statements designed to catch specific, known issues.
- IF a phone call originates from a new country, THEN flag it for review.
- IF more than five failed login attempts happen in under a minute, THEN lock the account.
- IF a credit card transaction is way over the user's typical spending limit, THEN block it.
These systems worked well for threats we already understood inside and out. Experts with deep domain knowledge could craft precise rules that gave clear, explainable results. When a rule fired, there was no mystery why.
The core limitation of early methods was their static nature. Both statistical thresholds and expert-written rules relied on a predefined understanding of what constituted an anomaly. They could not adapt on their own.
The Breaking Point and the Need for Learning
The real challenge came with the data explosion. The sheer volume, velocity, and variety of information generated by modern digital systems made these manual methods completely unsustainable. It became physically impossible for human experts to write rules for every conceivable threat—especially the new ones they'd never even seen before.
This created a massive bottleneck. The rigid, static checks of the past were too slow and brittle. They couldn't keep up with shifting user behaviors or evolving cyberattacks, leading to a flood of false alarms or, far worse, completely missed threats.
The stage was set for a fundamental shift. We had to move from static rules to intelligent, adaptive systems powered by machine learning and deep learning.
Before machine learning and AI took center stage, anomaly detection was built on two solid, time-tested pillars: statistical analysis and expert-written rules. Think of these as the original digital guards, operating on clear logic and mathematical certainty. While they have their limits, they still form the bedrock of many modern systems and are essential to understand.

Statistical Methods: The Original Outlier Detectives
At its heart, statistical anomaly detection is all about measuring surprise. Imagine you're tracking daily website traffic and you know that a typical day brings in around 10,000 visitors. One day, you see 12,000—a nice bump, but not earth-shattering. But what if the next day you hit 100,000? That’s not just a bump; it's a statistical shock.
This is the core idea behind methods like the Z-score. You don't need to be a math whiz to get it. The Z-score is just a simple way to quantify how "surprising" a new data point is by measuring how many standard deviations it sits from the average. A high Z-score screams that an event is highly unusual compared to everything you've seen before.
These methods are powerful because they give you a clear, mathematical reason for flagging an outlier. They're straightforward to set up and incredibly fast, which makes them perfect for environments where "normal" is well-defined and doesn't change much. It's possible to see these concepts scaled up by extending data platforms like Apache Druid with predictive analytics to handle massive statistical monitoring tasks.
Rule-Based Systems: The Expert's Playbook
While statistical methods crunch the numbers, rule-based systems look at behavior through the lens of a human expert. The best way to think about this approach is as a highly detailed playbook filled with strict "if-then" commands, all written by someone who knows the system inside and out.
This playbook gives the system direct orders on what constitutes a red flag. It’s a collection of explicit conditions that, if met, automatically trigger an alert.
- IF a user tries logging in from three different countries in under an hour, THEN flag the account as compromised.
- IF a server's CPU usage stays above 95% for more than 10 minutes, THEN send an alert to the operations team.
- IF an employee tries to access a sensitive file outside of business hours, THEN block the access and log the attempt.
The biggest win here is transparency. When a rule-based system flags something, you know exactly why. The logic is crystal clear, easy to audit, and simple for human operators to act on.
The Inevitable Limitations
For all their clarity and speed, these foundational methods share a critical weakness: they’re rigid. They operate on a static, unchanging view of the world. Statistical tools like the Z-score assume your data follows a predictable pattern, which is rarely the case in complex, real-world scenarios. Rule-based systems, which were the foundation of early SIEM platforms, need constant manual updates from analysts to keep up with new threats and often bury teams in false alarms.
The fundamental challenge with these foundational methods is their inability to adapt. They can't learn from new data or spot novel threats that don't fit into their predefined boxes.
This rigidity is exactly why the industry had to evolve. When "normal" itself changes—whether from business growth, shifting user behavior, or new types of cyberattacks—these old-school systems start to break down. They either miss new, sophisticated anomalies or they cry wolf constantly, flooding teams with false positives. This gap created an urgent need for the more dynamic, adaptive machine learning solutions that would soon change the game.
When machine learning entered the scene, it completely changed how we approach anomaly detection. Before ML, we were stuck with rigid statistical thresholds and rules that we had to write by hand. Machine learning gave us a way to build systems that could finally learn what "normal" looks like straight from the data itself.
This was a massive shift. Instead of giving a system a detailed playbook, we could let it analyze historical data, figure out the underlying patterns, and build its own understanding of normal behavior. This is what allows ML-powered systems to catch brand new threats and subtle deviations that older methods would have completely missed.
Unsupervised Learning Approaches
Most of the time, anomaly detection uses unsupervised learning. This just means we give the model a massive dataset of mostly normal activity without explicitly telling it what’s an anomaly and what isn’t. The model’s job is to get so good at understanding the texture of "normal" that anything out of place immediately sticks out. A few key methods have become the go-to standards in the industry.
H3: Density-Based Methods
Picture your data points as guests at a packed party. Most people are gathered in conversational groups. A density-based algorithm, like DBSCAN (Density-Based Spatial Clustering of Applications with Noise), is great at spotting the one person standing awkwardly by themselves in a corner, far from any of the clusters.
In data terms, anomalies are simply points that exist in low-density regions. Density-based techniques are fantastic at finding these isolated points, making them perfect for spotting outliers that don't fit into any established group.
These methods are especially powerful because they don't assume your data will form neat, spherical groups. They can identify clusters of all sorts of funky shapes, which is a huge advantage for complex datasets where "normal" doesn't follow a simple, clean pattern.
H3: Clustering-Based Methods
Another popular route is clustering, where an algorithm like K-Means tries to sort every data point into a set number of groups, or "clusters." The idea here is pretty straightforward: normal data points will cluster together with their peers.
Anomalies are the points left out in the cold. They're the misfits that don't really belong to any of the well-defined groups. Any data point that ends up far away from the center of any cluster is a prime suspect for being an anomaly. This works incredibly well when your data naturally has distinct groupings, like different types of user behavior.
Powerful Ensemble and Isolation Techniques
As the field evolved, more advanced models were developed specifically to hunt for anomalies with even greater precision, especially in high-dimensional data where the concept of "distance" starts to get a little fuzzy.
H3: Isolation Forest
The Isolation Forest algorithm has a brilliantly counterintuitive strategy. Instead of trying to profile what’s normal, it focuses on finding what’s easy to isolate. Think of your dataset as a dense forest and each data point as a leaf. An anomaly is like a single, brightly colored leaf that’s incredibly easy to separate from all the green ones on the branches.
The algorithm builds a series of random decision trees, repeatedly slicing through the data until every single point is on its own. Because anomalies are, by definition, "few and different," they require far fewer cuts to be isolated from the pack. This makes Isolation Forest ridiculously fast and efficient, which is why it’s a favorite for large-scale tasks like fraud detection and network security. For a closer look at how models like these are put to work, you can see how they're applied to platforms like Apache Druid for predictive analytics.
The chart below shows how some of these machine learning principles are extended into even more advanced deep learning architectures, comparing their performance and resource needs.
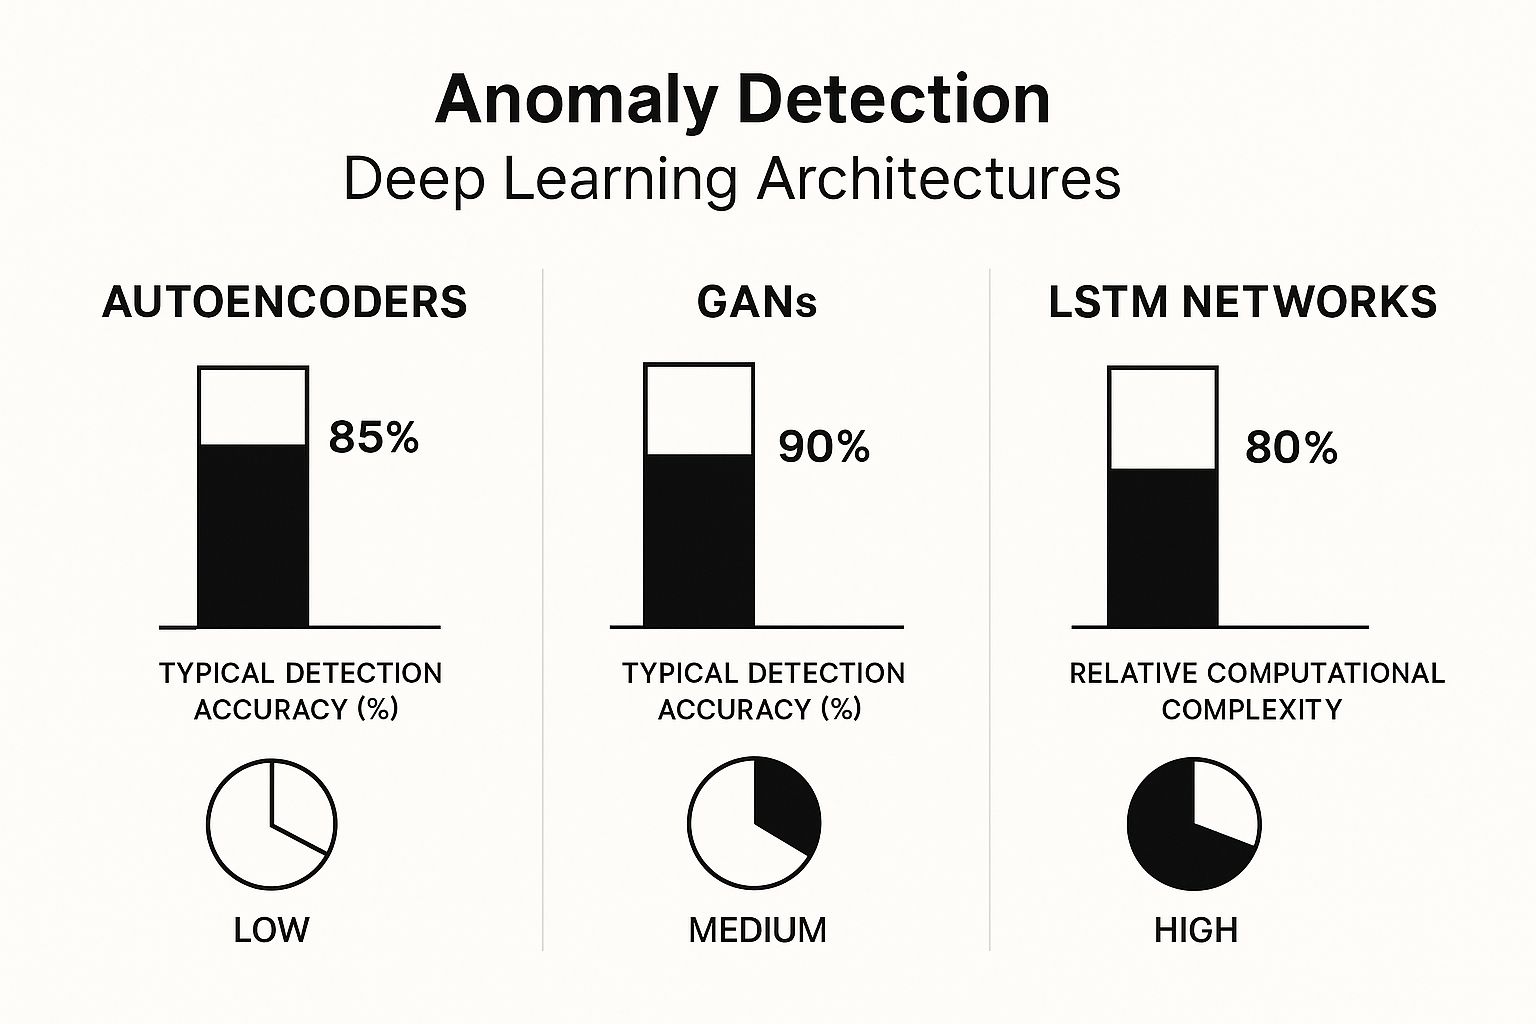
This visual really clarifies the trade-offs involved. For instance, a model like an LSTM can deliver incredible accuracy for time-series data but demands a ton of computational power. In contrast, an Autoencoder often strikes a good balance between performance and efficiency.
To help you choose the right tool for the job, here's a quick comparison of some of the most common machine learning techniques used for anomaly detection. Each has its own strengths and is better suited for certain types of problems.
Comparison of Machine Learning Anomaly Detection Techniques
| Technique | Core Principle | Ideal Use Case | Primary Advantage | Key Limitation |
|---|---|---|---|---|
| Isolation Forest | Anomalies are easier to "isolate" than normal points. | Large datasets, high-dimensional data (e.g., cybersecurity, fraud). | Extremely fast and memory-efficient. | Can be less effective if anomalies themselves form dense clusters. |
| DBSCAN | Anomalies are points in low-density regions. | Datasets with non-spherical clusters and noise. | Can find arbitrarily shaped clusters without pre-defining the number of clusters. | Performance suffers in very high-dimensional data (curse of dimensionality). |
| K-Means Clustering | Anomalies are far from any cluster's center. | Data with clear, distinct, and spherical groupings. | Simple to implement and understand. | Requires the number of clusters to be specified beforehand and struggles with complex shapes. |
| One-Class SVM | Learns a boundary around normal data points. | Datasets where one class (normal) is well-defined. | Good at creating a highly specific decision boundary for normality. | Sensitive to parameter tuning and can be computationally intensive on large datasets. |
This table should give you a solid starting point for thinking about which algorithm might be the best fit for your specific anomaly detection challenge.
The jump to machine learning gave our anomaly detection systems the brains they were missing. By learning directly from data, these models can adapt to new patterns and spot threats we couldn't have even imagined before, paving the way for the even more powerful deep learning methods we see today. If you're interested in what comes after implementation, our article on the importance of monitoring machine learning models is a great place to go next.
If traditional machine learning opened the door to modern anomaly detection, deep learning knocked the door off its hinges. These complex neural networks are inspired by the human brain, giving them an almost uncanny ability to learn and spot incredibly subtle patterns that other methods might miss. This is the new frontier for finding outliers, where systems can grasp the deep, underlying structure of data, whether it's an image, a financial transaction, or a complex time-series sequence.

Deep learning truly comes into its own when you're dealing with massive, messy, and unstructured data. Imagine trying to find a microscopic manufacturing defect in a 3D scan of a jet engine, or identifying a sophisticated, slow-burn cyberattack buried in terabytes of server logs. These are exactly the kinds of problems where simpler anomaly detection techniques hit a wall, but deep learning thrives.
Autoencoders: The Digital Forgery Expert
One of the most elegant deep learning tools for this job is the autoencoder. Think of it as a highly skilled art forger who also happens to be a world-class art restorer. Its job has two parts. First, it learns to take a "normal" piece of data—like a clean server log or a perfect product image—and compress it down to its most essential features. This is like creating a perfect, minimalist sketch. Then, it tries to reconstruct the original, full-detail piece from that compressed sketch.
When an autoencoder is trained only on normal data, it gets incredibly good at this compression-reconstruction process. But here's the clever part: when you feed it an anomaly, it fumbles. The sketch it creates is flawed because the input doesn't follow the rules it learned. As a result, the reconstructed output is a botched, distorted version of the original.
The "reconstruction error"—the measurable difference between the original input and the autoencoder's flawed output—is the key. A high reconstruction error acts like a blaring alarm, signaling that the data point is an anomaly.
This approach is unbelievably versatile. In manufacturing, autoencoders can analyze images to spot defective products on an assembly line. In cybersecurity, they can flag fraudulent transactions that don't match a user's typical financial "DNA."
RNNs and LSTMs: Mastering Time and Sequence
So often, the most critical anomalies aren't single events but patterns that unfold over time. One stock trade might seem harmless, but a rapid-fire sequence of odd trades could be a sign of market manipulation. This is where Recurrent Neural Networks (RNNs) and their more sophisticated cousins, Long Short-Term Memory (LSTM) networks, enter the picture.
These models were built from the ground up to understand sequences. They have a form of "memory" that allows them to consider past events when they evaluate the present. An LSTM can learn the normal rhythm of website traffic, the typical performance signature of industrial machinery, or the usual ebb and flow of financial markets.
This makes them a perfect fit for:
- Predictive Maintenance: An LSTM can monitor sensor data from a wind turbine and predict a failure by spotting a subtle degradation pattern long before it becomes catastrophic.
- Algorithmic Trading: In the financial world, LSTMs can identify bizarre trading patterns that might point to fraud or coordinated market manipulation.
- Network Security: They can analyze network traffic over time to catch those slow, methodical attacks that would be completely invisible to simpler, point-in-time detectors.
CNNs: Seeing Anomalies in Images and Beyond
When anomalies are visual, Convolutional Neural Networks (CNNs) are the undisputed champions. Originally built for tasks like image recognition (think "cat or dog"), CNNs are masters at identifying spatial patterns and textures. They can learn the visual fingerprint of a "perfect" product on a production line, down to the last pixel.
When an item with a scratch, a dent, or a slight color imperfection rolls past, the CNN immediately spots the deviation from the learned norm. This capability has revolutionized quality control in manufacturing, making it faster, more consistent, and far more accurate than relying on the human eye alone.
The move toward deep learning has been a seismic shift. These models have fundamentally changed anomaly detection by delivering a new level of pattern recognition. CNNs, for instance, are now stars in unsupervised anomaly detection for image and video, learning complex spatial hierarchies to spot defects in industrial settings. Meanwhile, faster recurrent networks like Simple Recurrent Units (SRUs) are being used for time-series analysis, capturing temporal dependencies in real-time systems. The recent emergence of large pretrained AI models, or foundation models, has pushed the field even further. You can read more about how these AI models have advanced anomaly detection and their growing market impact.
This evolution represents the current state-of-the-art. For organizations grappling with complex, high-stakes challenges, these advanced anomaly detection techniques are no longer a luxury—they are an essential part of the modern data toolkit. We've moved beyond just spotting outliers to truly understanding the context and sequence that make them anomalous. For more on the foundational ideas that led to these methods, our posts on the basics of anomaly detection and extending Apache Druid with predictive analytics offer excellent background.
Choosing the Right Anomaly Detection Technique
Knowing the different types of anomaly detection techniques is one thing, but making them work in the real world is a completely different beast. The real challenge—and where most projects stumble—is bridging the gap between theory and tangible results. This isn't about picking the most powerful or complex model; it's about selecting the most appropriate one for the job at hand.
That decision really boils down to a handful of critical questions about your data, your goals, and your operational limits.
The first place I always look is the data itself. What's its personality? Is it a static dataset, like a customer database, or does it flow continuously over time, like server logs or stock prices? Static data often plays nicely with clustering or density-based methods. But if you have time-series data, you'll almost certainly need something that understands sequence and context, like an LSTM model. Similarly, image data from a factory floor has its own set of ideal tools, with CNNs usually being the go-to.
Key Questions to Guide Your Choice
To get from a neat concept to a working system, you need a clear framework. Answering these questions will point you toward the right technique and help you sidestep common traps. Think of your answers as a blueprint for your entire anomaly detection strategy.
- What Does Your Data Look Like? Is it time-series (like sensor readings), transactional (like financial data), or visual (like product images)? The structure of your data is the single biggest factor driving your choice.
- Do You Have Labeled Data? If you're sitting on a goldmine of labeled examples—both normal and anomalous—supervised models can deliver incredible accuracy. But more often than not, you won't have this luxury. In that case, you'll be relying on unsupervised techniques that have to learn what "normal" looks like all on their own.
- How Important is Explainability? Does your team need to know exactly why an alert fired? A bank, for instance, might need a transparent statistical model to meet compliance rules. On the other hand, a tech company laser-focused on performance might be perfectly happy with a powerful but less interpretable deep learning model.
The trade-off between a model's performance and its explainability is a constant balancing act in anomaly detection. A "black box" model might catch more subtle issues, but if your team can't trust or act on its alerts, it's not actually effective.
Tackling Real-World Implementation Hurdles
Once you've picked a model, the real work begins. A few practical challenges often make or break an anomaly detection system, and getting them right is just as crucial as the initial algorithm choice.
A huge one is establishing a reliable baseline for "normal." That initial training period is critical. But what happens when your baseline naturally shifts over time because of business growth or changing user behavior? Your system has to adapt, otherwise it will quickly become stale and start throwing useless alerts. For a deeper dive into these foundational concepts, our post on the basics of anomaly detection provides some essential context.
You also have to strike a delicate balance between sensitivity and noise. A system that’s too sensitive will bury your team in false alarms, leading to serious alert fatigue. But one that’s too lenient will miss real threats. This almost always involves a fair bit of tuning to find that sweet spot where you catch genuine problems without overwhelming the people who need to act on them. For those looking to scale these systems, you can see how this applies by learning how to extend platforms with predictive analytics and anomaly detection.
Your Anomaly Detection Questions Answered
As you start working with anomaly detection, a lot of practical questions pop up. It's one thing to understand the theory, but it's another to apply it effectively. Let's tackle some of the most common questions that come up in the field.
Supervised vs. Unsupervised Detection
The biggest difference here comes down to your data—specifically, whether you know what you're looking for.
Supervised anomaly detection is like training a security guard by showing them photos of every employee and every known intruder. You need a dataset where both normal and anomalous data points are already labeled. The model then learns the distinct features of each group to tell them apart.
On the other hand, unsupervised anomaly detection is far more common because, in the real world, anomalies are often rare, and you don't know what the next one will look like. This is like a security guard who has memorized the building's normal daily rhythm so well that any deviation—an unfamiliar face, a door opening at the wrong time—immediately stands out. The model learns the "normal" and flags anything that doesn't fit the pattern.
Handling False Positives
One of the most persistent challenges is managing false positives, where your system flags normal activity as an anomaly. This is a classic "cry wolf" scenario that can quickly lead to alert fatigue for your team.
Tuning your model's sensitivity is the first line of defense. This usually means adjusting the threshold that triggers an alert. The goal is to find that sweet spot where you catch real issues without drowning your analysts in noise.
A powerful strategy here is to build a feedback loop. When an analyst marks an alert as a false positive, that information should be fed back into the model. This helps it learn from its mistakes and become more accurate over time.
Predicting Future Problems
So, can anomaly detection actually see the future? Not in a crystal ball sense, but it's incredibly good at spotting the subtle warning signs that show up long before a major failure.
Think of it like this: by monitoring the sensor data from a piece of industrial machinery, a model can detect faint vibrations or temperature changes that signal an impending breakdown. In cybersecurity, it can spot the kind of "low-and-slow" network activity that often precedes a major data breach.
By flagging these early precursors, these systems help organizations shift from reactive cleanups to proactive prevention. Properly tracking and interpreting these signals is a core part of effective machine-learning model monitoring, making sure you stay one step ahead of problems.

