
Real-World Examples of Explainable AI in Action: From Healthcare to Finance and Beyond: 8 Powerful Explainable AI Examples to Master in 2025
As artificial intelligence becomes deeply embedded in critical sectors like finance, healthcare, and autonomous systems, the demand for transparency has skyrocketed. Black-box models, where decisions are opaque and inscrutable, are no longer sufficient for high-stakes applications. This critical shift has given rise to Explainable AI (XAI), a set of techniques designed to demystify complex models and make their predictions understandable to humans.
Understanding why an AI makes a particular decision is crucial for building trust, ensuring fairness, debugging models, and meeting regulatory requirements like the EU AI Act. In this guide, we will dissect eight powerful explainable AI examples, moving beyond surface-level descriptions to provide a deep strategic analysis of how they work, where they excel, and how you can apply them.
We will explore the replicable strategies behind techniques like LIME and SHAP, offering actionable takeaways for data scientists, ML engineers, and technology leaders. This article provides a practical blueprint for implementing responsible and transparent AI solutions, breaking down methods from attention mechanisms to concept activation vectors. You will gain specific tactical insights into how to choose and apply the right XAI framework for your projects, ensuring your models are not only accurate but also accountable.
📚 This Blog is Part of the Explainable AI (XAI) Blog Series
Explore the complete 6-part journey into Explainable AI:
- 🔓 Part 1: Unlocking AI Transparency: A Practical Guide to Getting Started
- 🔍 Part 2: Building a Foundation for Transparency
- 🧠 Part 3: Applying LIME for Local Interpretability
- ⚖️ Part 4: Using SHAP for Global and Local Interpretability
- 🧭 Part 5: Detecting and Mitigating Bias with XAI Tools
- 🚀 Part 6: The Future of Explainable AI (XAI)
1. LIME (Local Interpretable Model-agnostic Explanations)
LIME, or Local Interpretable Model-agnostic Explanations, is a foundational technique that illuminates how complex “black box” models make individual predictions. Instead of trying to understand the entire model at once, LIME focuses on explaining a single output by creating a simpler, interpretable model that mimics the complex model’s behavior in a very small, localized area around that specific prediction. This makes it one of the most practical explainable AI examples for generating instance-level insights.
LIME works by taking an individual data point, such as an image or a row of customer data, and creating numerous slight variations, or “perturbations.” It then gets predictions from the complex model for all these new, slightly altered data points. By analyzing how the predictions change with these small input tweaks, LIME can build a simple, localized model (like a linear model) that highlights which features were most influential in the original decision.
Strategic Analysis and Application
Financial institutions leverage LIME to justify loan application denials, providing regulators and customers with clear, feature-based reasons rather than an opaque “computer says no.” Similarly, in healthcare, it can highlight which pixels in a medical scan most influenced a model’s diagnosis, giving clinicians a way to verify the AI’s reasoning. The core benefit is its model-agnostic nature; you can apply it to virtually any supervised learning model without needing to access its internal architecture.
The following infographic illustrates the three core steps LIME takes to generate a local explanation.
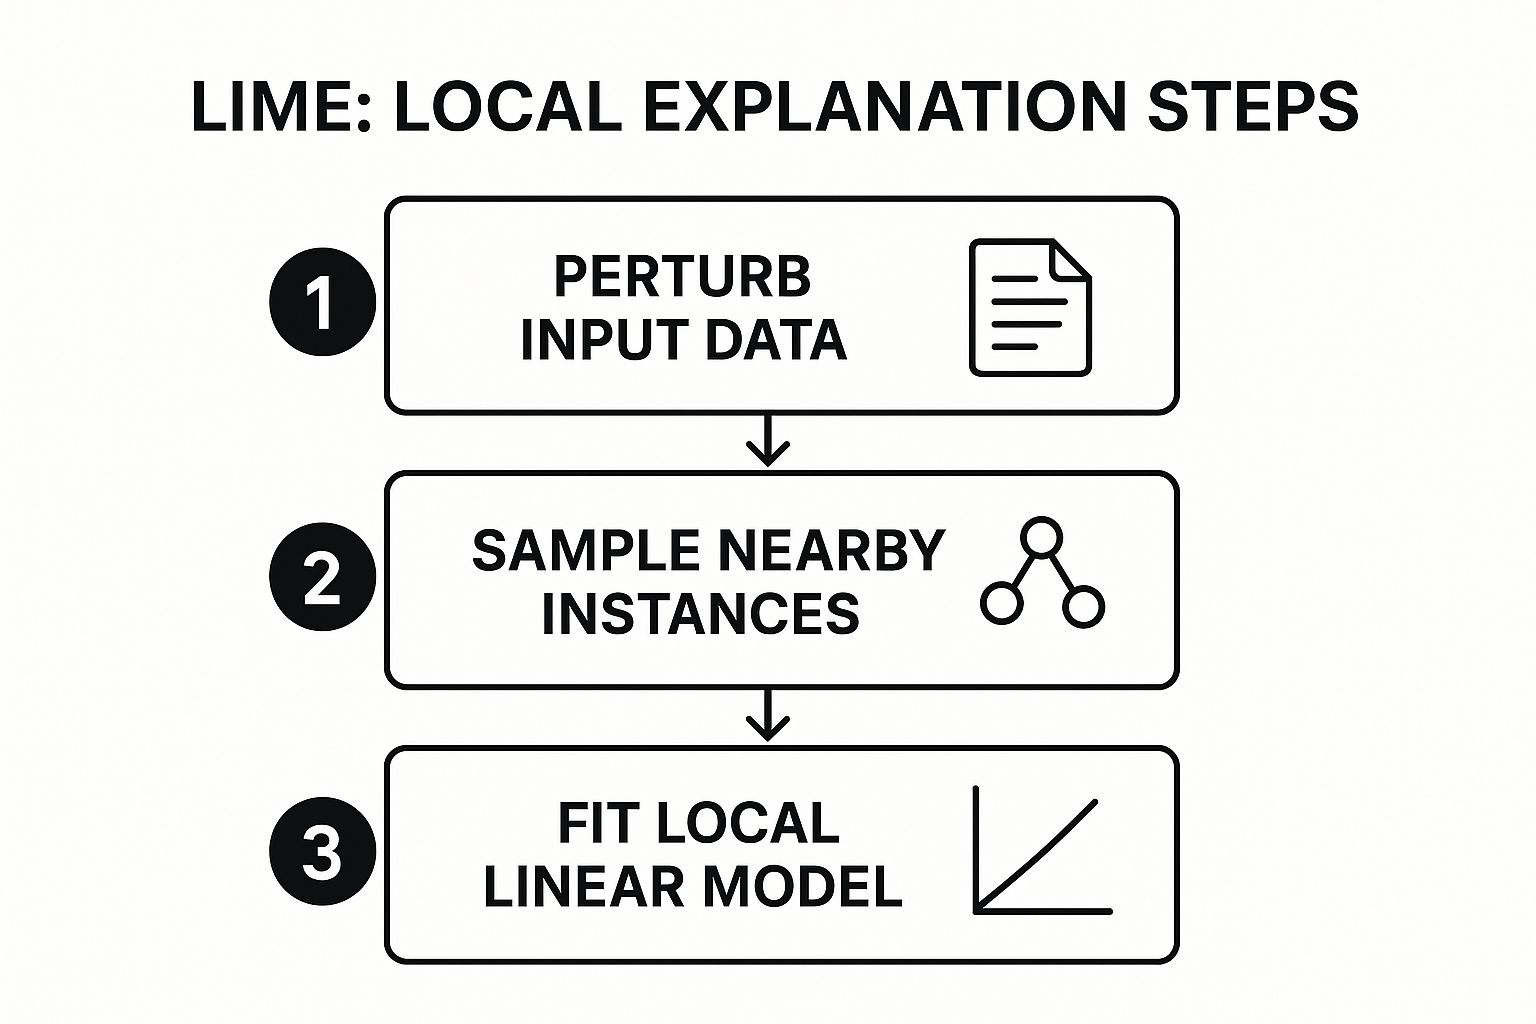
This process flow shows how LIME systematically deconstructs a single prediction into its most influential components, moving from data perturbation to a final, interpretable local model.
Actionable Takeaways
To effectively implement LIME, consider these strategies:
- Tailor Perturbations: The method for creating variations must match the data type. For text, this could mean removing words; for images, it could involve turning super-pixels on or off.
- Validate Locally: Because explanations are local, check the LIME outputs for several similar instances to ensure consistency in the model’s logic for that specific data cluster.
- Combine with Global Methods: Use LIME for individual explanations but pair it with a global method like SHAP (covered next) to get a complete picture of your model’s overall behavior.
2. SHAP (SHapley Additive exPlanations)
SHAP, which stands for SHapley Additive exPlanations, offers a unified and theoretically sound approach to interpreting model predictions. Rooted in cooperative game theory, it assigns each feature an importance value, known as a Shapley value, for every individual prediction. This value quantifies the marginal contribution of that feature to the model’s output compared to the average prediction. SHAP’s key strength is its ability to provide both local and global explanations, making it one of the most comprehensive explainable AI examples available.
Unlike LIME, which builds a local approximation, SHAP calculates feature contributions based on a solid mathematical foundation that guarantees properties like consistency and accuracy. This means the explanations are more reliable and directly comparable across different models. Its ability to decompose a prediction into the sum of its feature effects provides a complete picture of why a decision was made.

Strategic Analysis and Application
The power of SHAP is evident in its wide adoption across industries. In finance, banks use it to create transparent credit scoring models, ensuring that decisions are fair and can be explained to both customers and regulators. Uber leverages SHAP to explain its demand forecasting models, helping operational teams understand the key drivers behind predicted ride surges. Microsoft has integrated SHAP directly into Azure Machine Learning, providing it as a core tool for model interpretability.
The framework provides a suite of powerful visualizations. Summary plots give a high-level view of feature importance across the entire dataset, while force plots or waterfall plots break down the drivers of a single, specific prediction. This dual capability makes SHAP invaluable for both model debugging during development and for generating stakeholder-friendly reports post-deployment.
Actionable Takeaways
To maximize the value of SHAP in your projects, apply these tactics:
- Use Optimized Explainers: For tree-based models like XGBoost or LightGBM, always use
TreeSHAP. It is an optimized algorithm that computes exact Shapley values far more quickly than model-agnostic alternatives. - Start with Summary Plots: Begin your analysis with a SHAP summary plot. This gives you an immediate global understanding of which features are most impactful across all predictions, guiding deeper investigation.
- Drill Down with Waterfall Plots: For individual case analysis, such as explaining a specific customer’s churn prediction, use waterfall plots. They clearly illustrate how each feature value pushes the prediction away from the baseline to its final output.
- Sample for Performance: When working with very large datasets, the computational cost of SHAP can be high. Consider applying it to a representative sample of your data to gain insights efficiently without sacrificing analytical integrity.
3. Attention Mechanisms and Attention Visualization
Attention mechanisms, particularly those popularized by transformer architectures like in the seminal paper “Attention Is All You Need,” offer a powerful, built-in form of explainability. Instead of treating the model as a black box, attention allows us to see which parts of the input data the model “pays attention to” when generating an output. These attention weights can be visualized, often as heatmaps, revealing the model’s internal focus and making it a cornerstone among explainable AI examples, especially in natural language processing (NLP).
This technique works by calculating a set of attention scores for each element in the input sequence (like words in a sentence) relative to other elements. A higher score means the model places greater importance on that element when making a decision, such as translating a word or classifying a sentence’s sentiment. This provides a direct, quantitative measure of feature importance at the point of computation, rather than requiring a post-hoc analysis.

Strategic Analysis and Application
In practice, attention visualization is critical for debugging and trust-building in complex models. For instance, Google Translate uses attention to show how source and target words align, helping both developers and users understand the translation logic. In medical diagnostics, Vision Transformers (ViTs) can use attention heatmaps to highlight the specific regions in a medical image that led to a diagnosis, giving clinicians a verifiable basis for the AI’s conclusion. The key benefit is its inherent nature; explainability is a direct byproduct of the model’s architecture, not an add-on.
Analyzing these attention patterns is also fundamental to improving model performance. By understanding how a model processes information, developers can fine-tune its architecture or training data to correct illogical reasoning. This is closely related to the process of evaluating large language models, where understanding internal mechanisms is just as important as measuring output quality. You can learn more about how attention insights feed into the broader landscape of LLM evaluation metrics.
Actionable Takeaways
To leverage attention for explainability, implement these tactics:
- Analyze Across Layers: In deep models like BERT or GPT, examine attention patterns in different layers. Early layers often capture syntactic relationships, while deeper layers capture more complex, semantic connections.
- Use Attention Rollout: For deep transformers, simply visualizing one layer’s attention is not enough. Use techniques like attention rollout to aggregate attention scores across all layers for a more holistic view of the information flow.
- Compare with Human Intuition: A powerful validation step is to compare the model’s attention map with what a human expert would focus on. If the model highlights irrelevant words or image regions, it may indicate a data or model issue.
4. Gradient-based Attribution Methods (Integrated Gradients, Grad-CAM)
Gradient-based attribution methods provide a powerful lens into the decision-making process of neural networks, particularly in computer vision. Instead of treating the model as a black box, these techniques use the model’s own internal logic, specifically the gradients, to identify which input features were most influential for a given prediction. This makes them some of the most native and efficient explainable AI examples for deep learning.
The core idea is to calculate the gradient of the model’s output (e.g., the probability of a specific class) with respect to its input features (e.g., the pixels of an image). Grad-CAM (Gradient-weighted Class Activation Mapping) uses these gradients to produce a coarse localization map, highlighting important regions in an image. Integrated Gradients refines this by accumulating gradients along a path from a neutral baseline (like a black image) to the actual input, providing a more robust and less noisy attribution.
Strategic Analysis and Application
In medical imaging, Grad-CAM is instrumental for validating a model’s diagnostic reasoning. It can overlay a heatmap on a chest X-ray, showing clinicians precisely which areas the model identified as indicative of pneumonia, allowing for expert verification. Similarly, autonomous vehicle systems can use these methods to explain why a perception model identified a pedestrian or a stop sign, highlighting the specific visual cues it used.
Google has integrated the Integrated Gradients method directly into its TensorFlow toolkit, making it accessible for a wide range of applications. The key advantage of these methods is their computational efficiency and direct link to the model’s learning; they reveal what the model actually learned to focus on, not just what correlates with the output.
Actionable Takeaways
To effectively implement gradient-based methods, consider these strategies:
- Choose the Right Baseline: For Integrated Gradients, the choice of a baseline is critical. A black or blurred image often works well, but a more domain-specific neutral input can yield more meaningful attributions.
- Apply Smoothing: The raw gradient outputs can sometimes be noisy. Techniques like SmoothGrad, which averages gradients over multiple noisy copies of an input, can produce cleaner and more interpretable heatmaps.
- Combine with Other Methods: Use Grad-CAM for a high-level visual overview of “where” the model is looking and supplement it with feature-level methods like LIME or SHAP to understand “why” those regions are important.
5. Decision Trees and Rule-based Models
Decision trees and rule-based models are classic machine learning approaches that are inherently interpretable, making them powerful explainable AI examples by design. These models function by creating a clear, flowchart-like structure of if-then-else conditions. Each node in the tree represents a test on a specific feature, each branch represents the outcome of that test, and each leaf node provides a final decision or classification. This explicit path from input features to output makes the model’s logic transparent and easy for human experts to follow and validate.
Because they break down complex decisions into a series of simple, understandable steps, these models are often called “white box” models. Their strength lies in this intrinsic transparency, as they don’t require post-hoc interpretation techniques to understand their predictions. Rule extraction algorithms can also be used to distill the logic of more complex models, like neural networks, into a set of interpretable rules, bridging the gap between performance and explainability.

Strategic Analysis and Application
The transparent nature of decision trees makes them ideal for regulated industries. In banking, they are used for credit scoring, where a loan officer can trace the exact path of rules (e.g., “IF income > $50k AND credit history > 5 years, THEN approve loan”) to justify a decision to regulators or customers. In healthcare, they can support diagnostic processes by outlining the key symptoms and test results that lead to a particular diagnosis, allowing clinicians to verify the model’s reasoning against their own expertise. Similarly, insurance companies use them to create standardized, auditable rules for processing claims.
The primary benefit is regulatory compliance and trust. When a model’s logic is self-evident, it’s easier to ensure it is fair, unbiased, and compliant with legal standards like GDPR’s “right to explanation.” While a single decision tree might be less accurate than complex ensembles, understanding the trade-offs is crucial. You can learn more about the differences between decision trees and more complex methods to choose the right approach for your needs.
Actionable Takeaways
To effectively deploy decision trees and rule-based models, focus on these strategies:
- Prune for Simplicity: Use pruning techniques to remove branches that provide little predictive power. This prevents overfitting and, more importantly, keeps the model simple and truly interpretable.
- Control Tree Depth: Limit the maximum depth of the tree. A very deep tree can become as complex and difficult to understand as a black box model, defeating its purpose as an explainable tool.
- Validate Rule Sets with Experts: Involve domain experts to review the generated rules. They can identify rules that are counterintuitive or reflect data biases, ensuring the model’s logic aligns with real-world knowledge.
6. Counterfactual Explanations
Counterfactual explanations address the critical question: “What would need to change for the prediction to be different?” This technique provides actionable recourse by identifying the minimal alterations to input features that would flip a model’s outcome. Instead of just explaining why a decision was made, it shows a path to a desired alternative, making it one of the most human-centric and empowering explainable AI examples available.
The method works by algorithmically searching for the smallest possible change to a data point that crosses the model’s decision boundary. For instance, if a loan application is denied, a counterfactual explanation would not just state “low credit score,” but rather “your loan would have been approved if your credit score were 30 points higher and your debt-to-income ratio was 2% lower.” This transforms a static rejection into a clear, personalized action plan.
Strategic Analysis and Application
This approach is invaluable in regulated sectors where providing actionable feedback is a legal or ethical requirement. Financial services use it to guide rejected loan or credit card applicants on how to improve their chances, enhancing customer satisfaction and transparency. In hiring, it can inform candidates what specific qualifications or experiences they lacked for a role, turning a rejection into a developmental opportunity. Similarly, in healthcare, it can show a patient what lifestyle changes (e.g., lower cholesterol, increased physical activity) would move them into a lower risk category for a disease.
The core benefit is its actionability. It directly empowers individuals by giving them control and a clear path forward, which is crucial for building trust in automated decision-making systems. This makes the AI a collaborative partner rather than an unyielding judge.
Actionable Takeaways
To implement counterfactual explanations effectively, focus on generating realistic and helpful guidance:
- Incorporate Domain Constraints: Ensure the suggested changes are plausible and actionable in the real world. For example, suggesting a 40-year-old applicant become 25 is not feasible. The system must respect immutable or hard-to-change features.
- Generate Diverse Options: Provide multiple, varied counterfactual paths to a desired outcome. A user might find it easier to increase their savings than to change jobs, so offering different combinations of changes is more helpful.
- Validate with Domain Experts: Work with experts in the field (e.g., loan officers, doctors) to confirm that the generated counterfactuals make practical sense and are not just mathematical artifacts of the model. This ensures the advice is both valid and valuable.
7. Prototype and Example-based Explanations
Prototype and example-based explanations demystify model predictions by relating a new, unseen instance to similar, concrete examples from the training data. Instead of focusing on abstract feature importance, this approach provides explanations by analogy, answering the question: “What familiar data points led the model to this conclusion?” Techniques like influence functions identify which training examples were most pivotal in a specific prediction, while prototype networks learn representative examples for each class. This makes it one of the most intuitive explainable AI examples for grounding abstract decisions in real-world data.
The core principle is to find prototypes, or archetypal examples, that best represent a class or concept within the model’s learned space. When the model makes a prediction, it can then present the user with the prototype(s) most similar to the input instance. This method leverages the human ability to reason through comparison, making complex model behavior understandable by referencing familiar cases.
Strategic Analysis and Application
This approach is highly effective in domains where precedent and case-based reasoning are standard. In legal tech, an AI system can justify its assessment of a legal document by citing similar, historically adjudicated cases from its training data. In medical diagnostics, a model classifying a skin lesion as potentially malignant can show doctors images of confirmed malignant lesions from its training set that it found most similar. This allows clinicians to use their own expertise to validate the AI’s comparative reasoning.
The primary benefit is tangibility. It moves the explanation from a list of numbers or features to a direct comparison with something a user can see and understand. Recommendation engines can use this to explain why a movie was suggested by showing other movies the user rated highly that share similar characteristics, enhancing user trust and engagement.
Actionable Takeaways
To effectively implement prototype-based explanations, consider these strategies:
- Select Appropriate Metrics: The definition of “similar” is critical. Use a similarity metric (e.g., Euclidean distance for numerical data, cosine similarity for text) that is meaningful for your specific domain and data type.
- Validate Prototype Quality: Work with domain experts to ensure the selected prototypes are truly representative and not misleading outliers. An irrelevant or poorly chosen example can undermine the entire explanation.
- Address Privacy Concerns: Since this method exposes raw training data, be mindful of privacy. Use anonymized or privacy-preserving data, especially in sensitive fields like healthcare or finance, to avoid revealing personal information.
8. Concept Activation Vectors (CAVs) and Concept-based Explanations
Concept Activation Vectors (CAVs) shift the focus of explainability from low-level features like pixels or data points to high-level, human-understandable concepts. Pioneered by researchers at Google Brain, this technique explains a neural network’s predictions by measuring how sensitive the model is to specific concepts defined by humans. Instead of asking “which pixels mattered?”, TCAV (Testing with Concept Activation Vectors) asks “how much did the concept of ‘stripes’ or ‘dots’ influence this classification?” This makes it one of the most intuitive explainable AI examples for bridging the gap between a model’s internal logic and human reasoning.
The core idea is to define a “concept” by providing the model with a set of examples (e.g., images containing stripes). A vector representing this concept is then learned within the model’s high-dimensional activation space. By analyzing the directional derivative of a model’s output with respect to this concept vector, TCAV can produce a quantitative score that indicates the concept’s importance for a specific prediction or an entire class of predictions.
Strategic Analysis and Application
This approach is invaluable where explanations must align with domain-specific language. In medical imaging, a CAV can determine if a model’s diagnosis of skin cancer was positively influenced by the concept of “irregular borders,” a key diagnostic criterion used by dermatologists. Autonomous vehicle systems can use CAVs to verify that the concept of a “stop sign” or “pedestrian” correctly and strongly influences the decision to brake. It moves beyond post-hoc feature attribution to a more proactive and collaborative form of explanation where human knowledge directly steers the interpretability process.
A key advantage is its ability to test for biases and unintended correlations. For instance, you could test if a loan approval model is negatively sensitive to concepts associated with certain demographics, providing a concrete, quantifiable measure of algorithmic bias that other methods might not reveal so directly.
Actionable Takeaways
To effectively implement CAVs and TCAV, consider these strategies:
- Carefully Curate Concepts: The quality of the explanation depends entirely on the quality of the concept examples. Ensure your example sets are diverse, unambiguous, and accurately represent the concept you want to test. Involve domain experts in this curation process.
- Use Statistical Significance: TCAV provides a quantitative score. Use statistical tests to determine if a concept’s influence is statistically significant, helping you distinguish between random correlations and meaningful model behavior.
- Test for Unwanted Concepts: Don’t just test for concepts you expect the model to use. Actively test for concepts you don’t want it to use (e.g., gender or race in a resume screening model) to proactively identify and mitigate fairness issues.
Explainable AI Methods Comparison
| Explainability Method | 🔄 Implementation Complexity | 💡 Resource Requirements | ⭐ Expected Outcomes | 📊 Ideal Use Cases | ⚡ Key Advantages |
|---|---|---|---|---|---|
| LIME (Local Interpretable Model-agnostic Explanations) | Moderate; involves perturbation and local modeling | Low; Python library, minimal overhead | Local, interpretable explanations for individual predictions | Explaining single predictions across diverse ML models and data types | Model-agnostic, easy to implement, intuitive visuals |
| SHAP (SHapley Additive exPlanations) | High; requires Shapley value computations | Moderate to high; Python/R libraries, compute intensive | Mathematically consistent local and global explanations | Comprehensive model explanations needing rigor and rich visualization | Strong theoretical foundation, rich visualizations |
| Attention Mechanisms and Visualization | Moderate; embedded in model architecture | Low; requires transformer models and visualization tools | Real-time token-level attention explanations | NLP and sequence modeling tasks needing token-level insights | No extra overhead, intuitive real-time explanations |
| Gradient-based Attribution Methods (Integrated Gradients, Grad-CAM) | Moderate; requires gradient computations | Moderate; deep learning frameworks with autodiff | Fine-grained pixel/feature-level attributions | Image classification and computer vision requiring detailed explanations | Theoretically grounded, relatively fast computation |
| Decision Trees and Rule-based Models | Low; straightforward model training | Low; standard ML libraries | Complete transparency with clear decision paths | Applications needing full transparency and regulatory compliance | Inherently interpretable, fast inference |
| Counterfactual Explanations | High; involves optimization and constraints | Moderate to high; optimization tools needed | Actionable, minimal-change explanations | Decision support systems needing actionable guidance | Provides actionable recommendations |
| Prototype and Example-based Explanations | Moderate; similarity computation with data access | Moderate; requires access to training data | Intuitive, example-based model understanding | Domains benefiting from concrete examples and case-based reasoning | Intuitive through examples, useful for debugging |
| Concept Activation Vectors (CAVs) | High; needs concept definition and curation | Moderate to high; deep learning frameworks, datasets | Human-meaningful, concept-level explanations | Complex deep learning models requiring high-level concept understanding | Human-interpretable, useful for bias detection |
From Theory to Practice: Integrating XAI into Your AI Strategy
Our journey through these diverse explainable AI examples has illuminated a critical truth: transparency is no longer a “nice-to-have” feature but a core requirement for building robust, trusted, and effective AI systems. We’ve moved beyond the theoretical to see how specific techniques are being practically applied to demystify complex models. From the local, instance-specific insights of LIME to the game-theory-grounded rigor of SHAP, the tools available offer unprecedented clarity into the “why” behind AI predictions.
The key takeaway is that explainability is not a monolithic concept. The right approach depends entirely on your context. For a loan application system, the actionable guidance from counterfactual explanations is invaluable for the end-user. In medical imaging, the visual intuition of Grad-CAM and attention mechanisms allows clinicians to validate a model’s focus, building critical trust. For regulatory compliance, the inherent transparency of decision trees might be non-negotiable.
Synthesizing the Strategies for Your Roadmap
The most powerful implementations often involve a multi-layered approach. An organization might use SHAP during model development to understand global feature importance, deploy LIME for on-demand explanations in a production environment, and leverage Concept Activation Vectors (CAVs) to ensure the model aligns with high-level business concepts. This strategic blending of techniques creates a comprehensive explainability framework.
The crucial shift for any organization is to integrate XAI throughout the entire AI lifecycle.
- During Development: Use tools like Integrated Gradients and SHAP to debug models, identify data leakage, and ensure features are being weighted logically.
- In Deployment: Provide real-time explanations to end-users and operators to increase adoption and empower them to override incorrect predictions.
- For Governance: Generate audit trails and model documentation that satisfy regulatory requirements and internal risk management policies.
The Future is Explainable
Moving forward, the ability to build, deploy, and manage explainable AI will become a significant competitive differentiator. It is the bridge between powerful algorithms and real-world adoption, enabling organizations to mitigate risks, foster user trust, and unlock the full potential of their AI investments. Mastering these explainable AI examples is not just an academic exercise; it is a strategic imperative for any leader, practitioner, or data scientist aiming to build the next generation of responsible and impactful artificial intelligence. By making explainability a pillar of your AI strategy, you are not just building better models, you are building a more trustworthy and equitable technological future.
Ready to move from examples to enterprise-grade implementation? DATA-NIZANT provides the advanced AI governance and operationalization platform you need to embed transparency and control across your entire AI portfolio. Explore how our solutions can help you deploy robust, fair, and fully explainable models at scale by visiting DATA-NIZANT today.
🔍 Further Reading

