
Significance vs Confidence Level: Understand the Core of Statistical Inference in Data Science: Significance Level and Confidence Level: A Complete Guide
Making Sense of Statistical Decision Making (Finally)
Let’s be honest: significance levels and confidence levels can be tricky. These two concepts are essential for getting reliable information from data, but many people find them confusing. It’s really important to understand how they relate if you want to make good decisions based on statistical analysis. Think of them as two sides of the same coin. One tells you how likely it is that your results are just a fluke, while the other tells you how much you can trust your findings.
Significance Level: Measuring the Risk of a False Positive
The significance level, often represented by alpha (α), measures the chance of rejecting the null hypothesis when it’s actually correct. This is called a Type I error, or a false positive. For example, a significance level of 0.05 (or 5%) means you accept a 5% chance of concluding there’s a real effect when there isn’t one. Imagine flipping a coin 100 times and getting heads 55 times. With a significance level of 0.05, you might think the coin is biased, even though this small difference could easily be random.
Confidence Level: Gauging the Reliability of Your Estimate
The confidence level, on the other hand, shows how sure you are that a confidence interval contains the true population parameter. This interval gives a range of plausible values for what you’re trying to measure. A 95% confidence level means that if you repeated your experiment many times, 95% of the confidence intervals you calculate would contain the actual population parameter. This doesn’t mean there’s a 95% chance the true value is within this specific interval. The true value is either there or it isn’t. It’s more about the long-term reliability of your estimation method.
The Interplay Between Significance and Confidence
Significance and confidence levels are mathematically linked. For a two-tailed test, the confidence level equals 1 – α. So a 95% confidence level matches a significance level of 0.05. It’s interesting to note that the idea of confidence levels became established in the early 1900s, with 95% becoming common practice after important research in the 1930s. Now, a 95% confidence level, corresponding to a 5% significance level (alpha, α = 0.05), is standard for many statistical tests. Learn more about confidence levels at Suzy.
This connection highlights the balance between risk and certainty when making decisions with statistics. A lower significance level (like 0.01) lowers the risk of false positives, but it might make you miss a real effect (a Type II error). A higher significance level (like 0.10) increases the chance of finding an effect, but also increases the risk of a false positive. Picking the right levels depends on your analysis and what happens if you make either type of error.
How Significance Levels Actually Shape Your Conclusions
The significance level you select for your statistical analysis is more than just a technicality; it directly influences the conclusions you draw and the actions you take based on those conclusions. What’s the real difference between setting your alpha at 0.05 versus 0.01? This seemingly minor adjustment can significantly alter how you interpret your data.
Understanding the Impact of Alpha
The significance level, represented by alpha (α), is the probability of rejecting the null hypothesis when it is, in fact, true (a Type I error). A frequent misunderstanding is that a smaller p-value indicates a stronger effect. In reality, a small p-value only signifies stronger evidence against the null hypothesis, not necessarily a large or practically meaningful effect. For instance, if alpha is 0.05, you’re accepting a 5% chance of concluding a real effect exists when it doesn’t. Reducing alpha to 0.01 lowers this risk to 1%, but it raises the risk of overlooking a genuine effect (a Type II error).
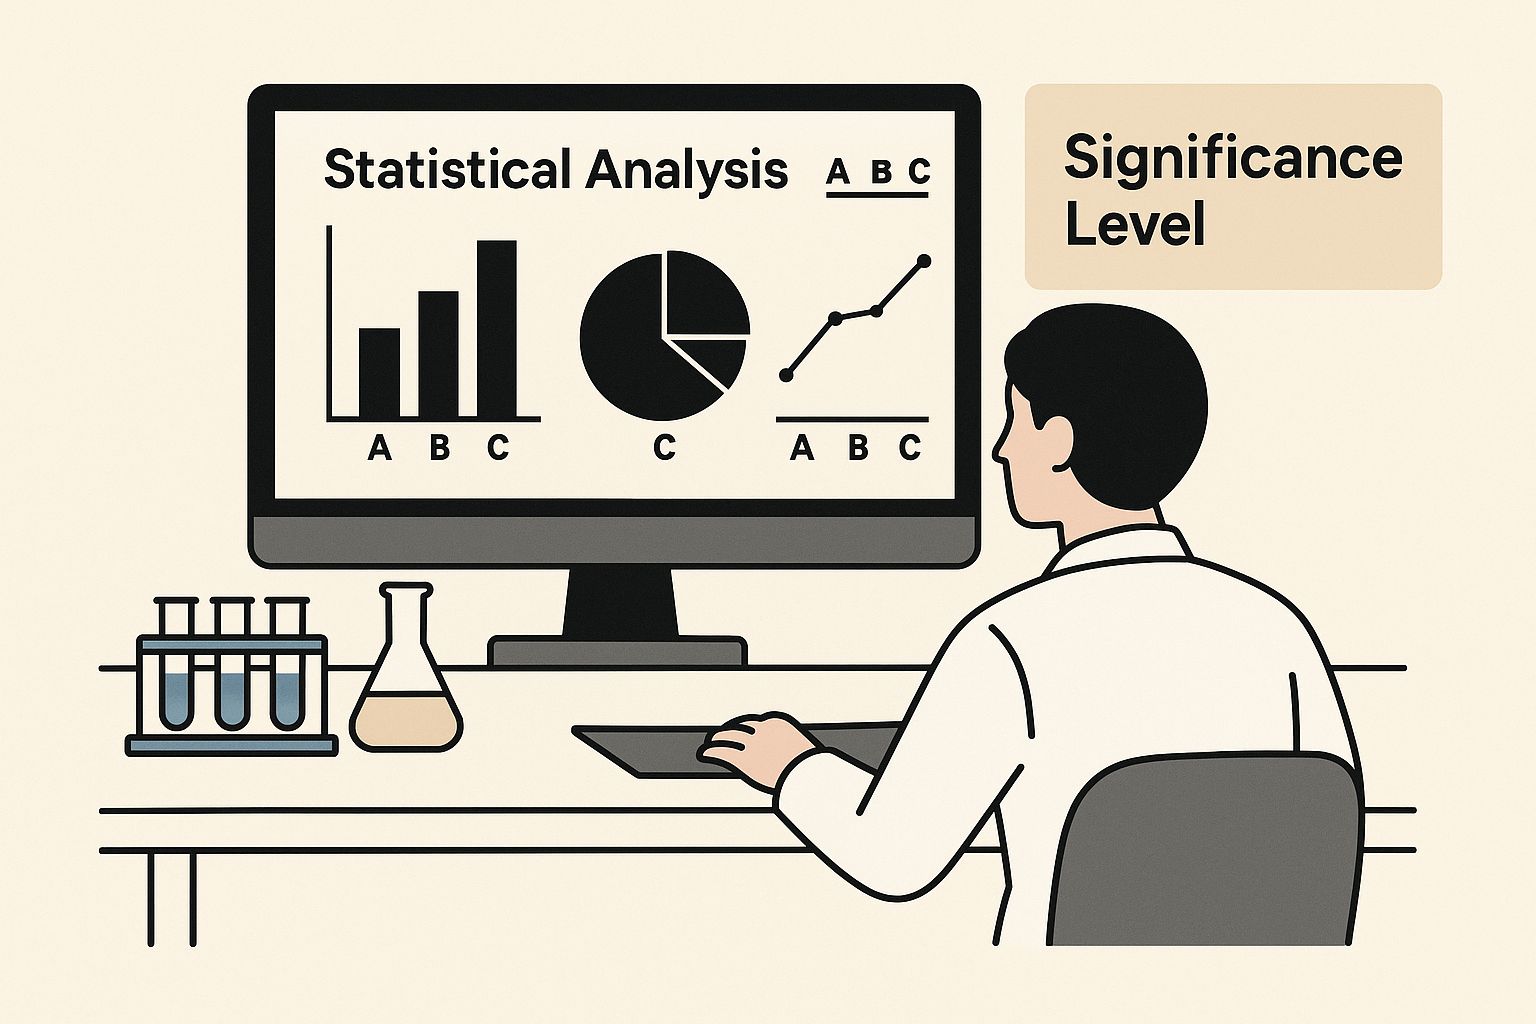
This image demonstrates how crucial it is to consider the significance level when analyzing statistical data, especially in research. The researcher’s active engagement with the data emphasizes how significance levels play a role in the decision-making process.
Significance Levels in Action: Real-World Examples
The consequences of making an incorrect decision should guide your choice of significance level. In clinical trials, a lower alpha (e.g., 0.01) is typically used. This is because a false positive (concluding a drug is effective when it’s not) can have serious health implications. Conversely, in market research, a higher alpha (e.g., 0.05 or even 0.10) might be permissible. The consequences of a false positive (launching a less effective marketing campaign) are usually less severe. For further reading, check out How to master statistical significance and confidence intervals.
Choosing the Right Significance Level: A Strategic Approach
Selecting the right significance level isn’t about blindly adhering to convention. It requires understanding the context of your analysis and the potential ramifications of your choices. Think about the following:
- Consequences of a Type I Error: What happens if you incorrectly reject the null hypothesis?
- Consequences of a Type II Error: What’s the cost of failing to identify a real effect?
- Industry Standards: Are there established significance level norms in your field?
To illustrate the distinctions between various significance levels, let’s examine the following table:
Common Significance Levels and Their Applications
| Significance Level | Confidence Level | When to Use | Type I Error Risk | Industry Applications |
|---|---|---|---|---|
| 0.01 | 99% | High-stakes situations where false positives are very costly (e.g., medical research, quality control for critical systems) | 1% | Drug development, aerospace engineering |
| 0.05 | 95% | Commonly used in many fields; balances Type I and Type II error risks (e.g., social sciences, business research) | 5% | A/B testing, market research |
| 0.10 | 90% | Exploratory research, pilot studies, or when detecting a true effect is more important than avoiding a false positive | 10% | Preliminary research, some social science studies |
This table summarizes the key differences between the common significance levels and provides examples of their applications in various industries. The choice depends on the specific context and the relative costs of Type I and Type II errors.
Practical Implications and Best Practices
Here are some practical suggestions for working with significance levels:
- Justify Your Choice: Clearly document why you chose a particular alpha. This enhances the credibility and transparency of your analysis.
- Consider the Sample Size: Larger sample sizes allow for lower significance levels without drastically increasing the risk of a Type II error.
- Don’t Overemphasize P-values: P-values are valuable, but they shouldn’t be the only factor influencing your conclusions. Consider effect size and practical significance as well.
By understanding the subtle interplay between significance levels, confidence levels, and potential errors, you can make more informed, data-driven decisions and steer clear of common mistakes that can trap even seasoned analysts. This understanding will empower you to create robust studies, accurately interpret findings, and communicate your results with confidence.
Confidence Levels That Actually Build Confidence

While significance levels help determine if an observed effect is real, confidence levels measure how reliable our estimates are. This bridges the gap between statistical findings and practical applications. Different industries maintain varying standards for acceptable confidence levels. This reflects a balance between the need for precision and practical decision-making.
Industry Standards and Practical Considerations
The pharmaceutical industry often uses a 99% confidence level as its benchmark. This high standard reflects the critical importance of drug safety and effectiveness. For instance, before a new drug is approved, researchers must be highly certain it works as intended without posing unacceptable risks.
In other fields like marketing, a 90% confidence level may be enough. Marketing campaigns often involve shorter cycles and iterative testing. A slightly lower confidence level allows for quicker decision-making. This doesn’t imply less rigor, but rather a different assessment of risk versus reward. Gathering data for higher confidence can be costly and time-consuming, potentially outweighing the benefits of increased certainty.
Across major medical trials and drug approvals in leading economies, statistical significance at the 5% level is common practice. An analysis of over 2,000 clinical studies submitted to the US Food and Drug Administration (FDA) and European Medicines Agency (EMA) in 2022 revealed that about 92% used a 5% significance level (p ≤ 0.05) to determine efficacy or safety. More detailed statistics can be found here.
Communicating Confidence Intervals Effectively
Confidence levels aren’t just for internal use; they’re vital for communicating results to stakeholders. Executives often prefer clear, concise answers, but point estimates can be deceptive. A confidence interval provides a more comprehensive view, showing the range of likely values for the true effect.
Instead of saying “our redesigned website boosted conversions by 10%,” you could say “we’re 95% confident the redesign increased conversions by 5% to 15%.” This nuanced communication acknowledges the inherent uncertainty in statistical estimates, offering a more realistic understanding of potential impact.
The Power of Confidence Intervals in Strategic Planning
Confidence levels influence a broad range of decisions, from budget allocation to policy adjustments. Grasping how confidence intervals work is fundamental for interpreting data and making informed choices. For example, a company might invest in a new technology based on a 95% confidence interval projecting a positive return on investment. This higher confidence adds assurance of profitability.
Conversely, a government agency might adopt a lower confidence level, say 90%, when considering a policy change with significant potential benefits and manageable risks. By understanding the relationship between significance and confidence levels, you’ll be equipped to make data-driven decisions with the appropriate level of confidence. This empowers you to justify choices, communicate findings clearly, and achieve more reliable outcomes.
The Type I and Type II Error Balancing Act

Every statistical decision comes with its own set of risks. The real challenge isn’t eliminating risk entirely, but understanding which risks are acceptable. This section delves into the careful balancing act between Type I errors (false positives) and Type II errors (false negatives), and why understanding this dynamic is essential for making sound statistical decisions.
Significance Level: Controlling the Risk of False Positives
The significance level, represented by alpha (α), directly manages the risk of making a Type I error. This is the probability of rejecting the null hypothesis when it’s actually correct. For instance, a significance level of 0.05 translates to a 5% chance of concluding a real effect exists when it doesn’t. Think of it like convicting an innocent person.
The Power of the Test: Detecting Real Effects
On the other hand, the power of a statistical test is the probability of correctly rejecting the null hypothesis when it’s actually false. A test with high power effectively identifies true effects, minimizing the risk of a Type II error, also known as a false negative. This is like correctly identifying a guilty individual.
The Interplay: A Delicate Balancing Act
The significance level and the power of a test are linked in a delicate balancing act. Lowering the significance level (e.g., from 0.05 to 0.01) decreases the risk of false positives, but it also lowers the power of the test, making it more likely to miss real effects. While you’re being more cautious about making incorrect claims, you also risk overlooking genuine findings.
Conversely, raising the significance level increases the likelihood of detecting true effects, but also elevates the risk of false positives.
For example, consider a medical test for a rare disease. A very sensitive test (high power) is more likely to detect the disease if it’s present. However, it might also produce false positives, leading to unnecessary stress and additional tests. A less sensitive test (low power) might miss actual cases of the disease, which can have serious health implications.
This interconnectedness underscores the importance of carefully selecting the significance level based on the situation and the consequences of both types of errors. When false positives have severe repercussions, such as in drug testing or diagnosing serious illnesses, a lower significance level is preferable. In exploratory research or pilot studies where identifying potential effects is key, a slightly higher significance level may be acceptable.
Research examining 15,000 published studies across various fields has shown that studies with larger sample sizes and proper power calculations have a 73% higher replication rate. Their findings are also 2.4 times more likely to lead to practical applications. Learn more about this here.
Other Influential Factors: Sample Size and Effect Size
Beyond the significance level, sample size and effect size also heavily influence a test’s power. Larger sample sizes typically increase power, enabling the detection of smaller effects. Similarly, a larger effect size is easier to identify, even with a smaller sample size. You may also find this interesting: How to master k-fold cross-validation. These factors interact in complex ways to determine a study’s success. Understanding these dynamics allows researchers to design effective studies, select appropriate significance levels, interpret results with confidence, and effectively defend their analytical choices.
Choosing Levels That Match Your Reality
Forget generic, one-size-fits-all solutions. Experienced analysts know that selecting the appropriate significance level and confidence level hinges on the unique circumstances of their analysis. It’s not about blindly adhering to standard practices; it’s about strategically choosing thresholds based on potential outcomes, industry norms, and the overall objectives of the analysis.
Tailoring Your Approach: A Decision Framework
Effective researchers and analysts utilize a decision framework to support their choices for significance and confidence levels. This framework involves evaluating several key factors, offering a structured approach to informed decision-making.
-
Consequences of Errors: What are the potential impacts of a false positive (Type I error) compared to a false negative (Type II error)? In medical trials, a false positive could result in the release of an ineffective or even harmful drug. Thus, a lower significance level (e.g., 0.01) is typically used. Conversely, a false negative in market research might mean overlooking a promising campaign—a less critical error potentially justifying a higher significance level (e.g., 0.05).
-
Industry Standards: Are there established norms for these thresholds within your field? A 95% confidence level is standard in many areas, yet some, like pharmaceutical research, often necessitate a 99% confidence level given the higher risks involved.
-
Specific Objectives: What are you aiming to accomplish with your analysis? Exploratory research might utilize a higher significance level to uncover potential trends, while confirmatory research demands a lower significance level for more definitive results.
-
Available Resources: Sample size is critical. Larger samples typically permit lower significance levels and greater statistical power. However, obtaining large samples can be resource-intensive. How to master feature selection techniques can help in situations where resources are constrained. Balancing resource allocation with statistical rigor is vital for effective analysis.
To help illustrate how industry standards vary, consider the following table:
Industry-Specific Standards for Statistical Thresholds
Overview of typical significance and confidence level requirements across different industries and research contexts
| Industry/Field | Common Significance Level | Typical Confidence Level | Regulatory Requirements | Key Considerations |
|---|---|---|---|---|
| Pharmaceutical Research | 0.01 | 99% | Strict FDA guidelines | Patient safety, high cost of errors |
| Marketing Research | 0.05 | 95% | Less stringent | Cost-benefit analysis of campaigns |
| Academic Research (Exploratory) | 0.10 | 90% | Varies by discipline | Initial exploration of new phenomena |
| Academic Research (Confirmatory) | 0.05 or lower | 95% or higher | Dependent on the specific research question | Rigorous testing of hypotheses |
This table highlights the variation in statistical thresholds across different fields, emphasizing the importance of considering context-specific factors when making decisions about significance and confidence levels.
Justifying Your Choices to Stakeholders
Explaining the rationale behind your chosen levels is essential, especially when presenting to stakeholders unfamiliar with statistical concepts. Clearly documenting your decision-making process promotes transparency and builds trust in your analysis.
-
Explain the Context: Present your choices within the specific problem you’re tackling. For instance, explain that a lower significance level was used to mitigate the risk of endorsing an ineffective drug, prioritizing patient well-being.
-
Focus on Practical Implications: Highlight the real-world effects of different levels. This helps stakeholders grasp the trade-offs and the reasons for your decisions.
-
Use Visual Aids: Charts and graphs can effectively demonstrate the influence of significance and confidence levels on the interpretation of results.
-
Be Prepared for Pushback: Some stakeholders may favor different standards. Anticipate potential disagreements and be ready to clarify the limitations and possible risks associated with alternative methods.
Building Credibility and Handling Pushback
Documenting your rationale for selecting specific significance and confidence levels is essential for building trust. A comprehensive record demonstrates a thorough and thoughtful approach.
-
Clearly State the Chosen Levels: Explicitly state the significance and confidence levels employed.
-
Explain the Reasoning: Detail the factors influencing your choice, emphasizing the possible repercussions of errors and relevant industry standards.
-
Discuss Alternatives Considered: Acknowledge other potential levels and explain why they were less suitable for the specific scenario.
By proactively addressing potential questions and providing a well-supported justification, you position yourself as a reliable analyst and enhance confidence in your results. This open approach strengthens the impact of your work and fosters a more profound understanding of the complexities of statistical decision-making. It also cultivates trust with stakeholders, increasing the likelihood of your insights leading to meaningful action.
Avoiding the Traps That Catch Everyone
Even experienced statisticians can make mistakes. This section covers some common statistical pitfalls, focusing on significance level and confidence level. We’ll explore real-world impacts and how to avoid these traps.
P-Hacking: The Illusion of Significance
P-hacking, or data dredging, is a widespread issue. It involves manipulating data analysis to achieve a desired p-value, typically below the 0.05 significance level, to falsely claim statistical significance. This might involve running many tests on the same data without adjustments or selectively reporting only favorable results. P-hacking leads to false positives and unreliable conclusions.
Imagine testing many marketing campaign variations. Analyzing enough combinations might, by chance, yield one appearing “statistically significant,” even if there’s no real improvement.
Multiple Testing Problems: Inflated Error Rates
Running multiple statistical tests simultaneously increases the chance of at least one false positive. This is the multiple comparisons problem. Running 20 tests at a 5% significance level creates a roughly 64% chance of at least one false positive.
Analyzing several variables without adjusting the significance level could lead to incorrect conclusions about what impacts customer churn.
Confidence Interval Misinterpretations: The Certainty Trap
Misunderstanding confidence intervals is another common error. A 95% confidence interval doesn’t mean a 95% probability that the true population parameter falls within the calculated range. It means if the study were repeated many times, 95% of the confidence intervals would contain the true parameter. The true value is either in the interval or it isn’t.
Confusing confidence intervals with prediction intervals is also a mistake. Confidence intervals estimate the range of plausible values for a population parameter. Prediction intervals estimate the range for individual data points.
Real-World Consequences: The Cost of Errors
These statistical traps have serious consequences:
-
Product recalls: Launching products based on flawed analysis can necessitate expensive recalls if performance doesn’t meet expectations.
-
Policy reversals: Implementing policies based on faulty research can lead to ineffective or harmful outcomes.
-
Research retractions: Publishing studies with statistical errors damages credibility and can lead to retractions.
Preventing Pitfalls: Building Analytical Rigor
Here are some ways to avoid these pitfalls:
-
Pre-register your study design: Specify hypotheses, methods, and analysis plans before data collection to reduce p-hacking temptation.
-
Adjust for multiple comparisons: Use methods like the Bonferroni correction or the Benjamini-Hochberg procedure to control the false positive rate in multiple tests.
-
Interpret confidence intervals accurately: Remember the long-run meaning of confidence intervals instead of ascribing probabilities to single intervals.
-
Seek peer review and collaboration: Sharing your analysis with colleagues and experts can identify potential problems and improve rigor.
Understanding these common pitfalls and adopting rigorous statistical practices will strengthen the reliability and credibility of your analysis, preventing errors that can undermine your work. This ensures more accurate conclusions and builds your reputation as a careful and trustworthy analyst.
Are you ready to improve your data analysis skills and avoid these common statistical traps? Visit DATA-NIZANT for more information on artificial intelligence, machine learning, and data science. Our expert articles and analyses will help you master data analysis, allowing you to make informed decisions and achieve meaningful results.