
Master Cluster Analysis Time Series – Proven Data Science Techniques
Understanding What Makes Time Series Clustering Different
Traditional clustering methods often struggle with time series data. This is because they typically group data points based on similar values, ignoring the essential aspect of temporal dependencies. Time series cluster analysis, on the other hand, recognizes the importance of the order of data points. This fundamental difference changes how we approach pattern recognition.
Imagine analyzing customer purchasing behavior. A standard clustering algorithm might group customers who spent similar amounts. Time series clustering, however, considers when those purchases happened. This allows us to distinguish between customers who buy regularly and those who make infrequent, large purchases, providing valuable insights. This crucial difference necessitates specialized techniques for time series clustering.
Challenges Specific to Time Series Clustering
One major challenge is dealing with irregular sampling rates. Time series data isn't always collected at consistent intervals, and this inconsistency can distort clustering results if not addressed. Computational complexity also presents a significant hurdle. Analyzing large time series datasets can be demanding, requiring efficient algorithms and powerful computing resources. You might find this helpful: How to master time series forecasting.
Another challenge lies in handling missing data. Time series data is often incomplete, requiring suitable imputation methods to maintain data integrity. Choosing appropriate distance measures is also critical. Standard distance metrics may not accurately reflect the similarity between time series exhibiting different temporal dynamics.
Key Considerations for Effective Time Series Clustering
To overcome these challenges, successful analysts utilize several strategies. These include employing algorithms specifically designed for unevenly sampled data and implementing techniques for filling missing values. Time series clustering can be performed based on various criteria, including having similar values over time, following similar trends of increase and decrease, and displaying similar patterns.
For instance, in environmental monitoring, sensor data can be clustered to identify areas with comparable pollution levels over time. Learn more about this application here. Furthermore, selecting suitable distance measures, such as Dynamic Time Warping (DTW), is vital for accommodating temporal shifts and variations in speed. DTW aligns time series that might be similar in shape but offset in time, leading to more accurate comparisons.
Finally, understanding the limitations of applying conventional clustering algorithms to time series data is paramount. Recognizing when these algorithms might produce misleading results is a key component of responsible data analysis. These considerations are fundamental for mastering more advanced time series clustering techniques.
How Neural Networks Are Changing The Game
The integration of neural networks into time series cluster analysis has opened up exciting new possibilities for understanding complex temporal data. Traditional methods often struggled to capture the nuances of time-ordered data, but deep learning approaches offer a more adaptable and powerful set of tools. This allows data scientists to tackle problems that were previously very difficult to solve.
One of the most significant advancements in time series clustering over the past decade has been the integration of neural networks. This evolution has transformed the field, enabling analysis of the complex, high-dimensional data common in disciplines like computer science, biology, and environmental science. Explore this topic further here. Consider analyzing stock market data, for example. Traditional clustering might group stocks with similar prices. However, neural networks can identify clusters based on the patterns of price fluctuations over time – a much more insightful approach.
Neural Network Architectures for Time Series Data
Different neural network architectures are better suited to capturing specific aspects of time series data. Recurrent Neural Networks (RNNs), particularly those with Long Short-Term Memory (LSTM) units, are designed to capture sequential dependencies. This makes them ideal for analyzing data where the order of events is crucial, such as natural language processing or speech recognition.
Convolutional Neural Networks (CNNs), traditionally used in image recognition, are also surprisingly effective at identifying local patterns in time series. They can pinpoint short-term trends or repeating motifs within the data, making them a powerful tool for tasks like anomaly detection.
Real-World Implementations and Challenges
Neural networks are being used in production environments for time series cluster analysis across many fields. In finance, they identify groups of assets with similar trading patterns. In manufacturing, they detect clusters of machines exhibiting similar performance degradation, which allows for proactive maintenance.
However, implementing these systems comes with its own set of challenges. The infographic below visualizes some preprocessing steps required to prepare time series data for these models.
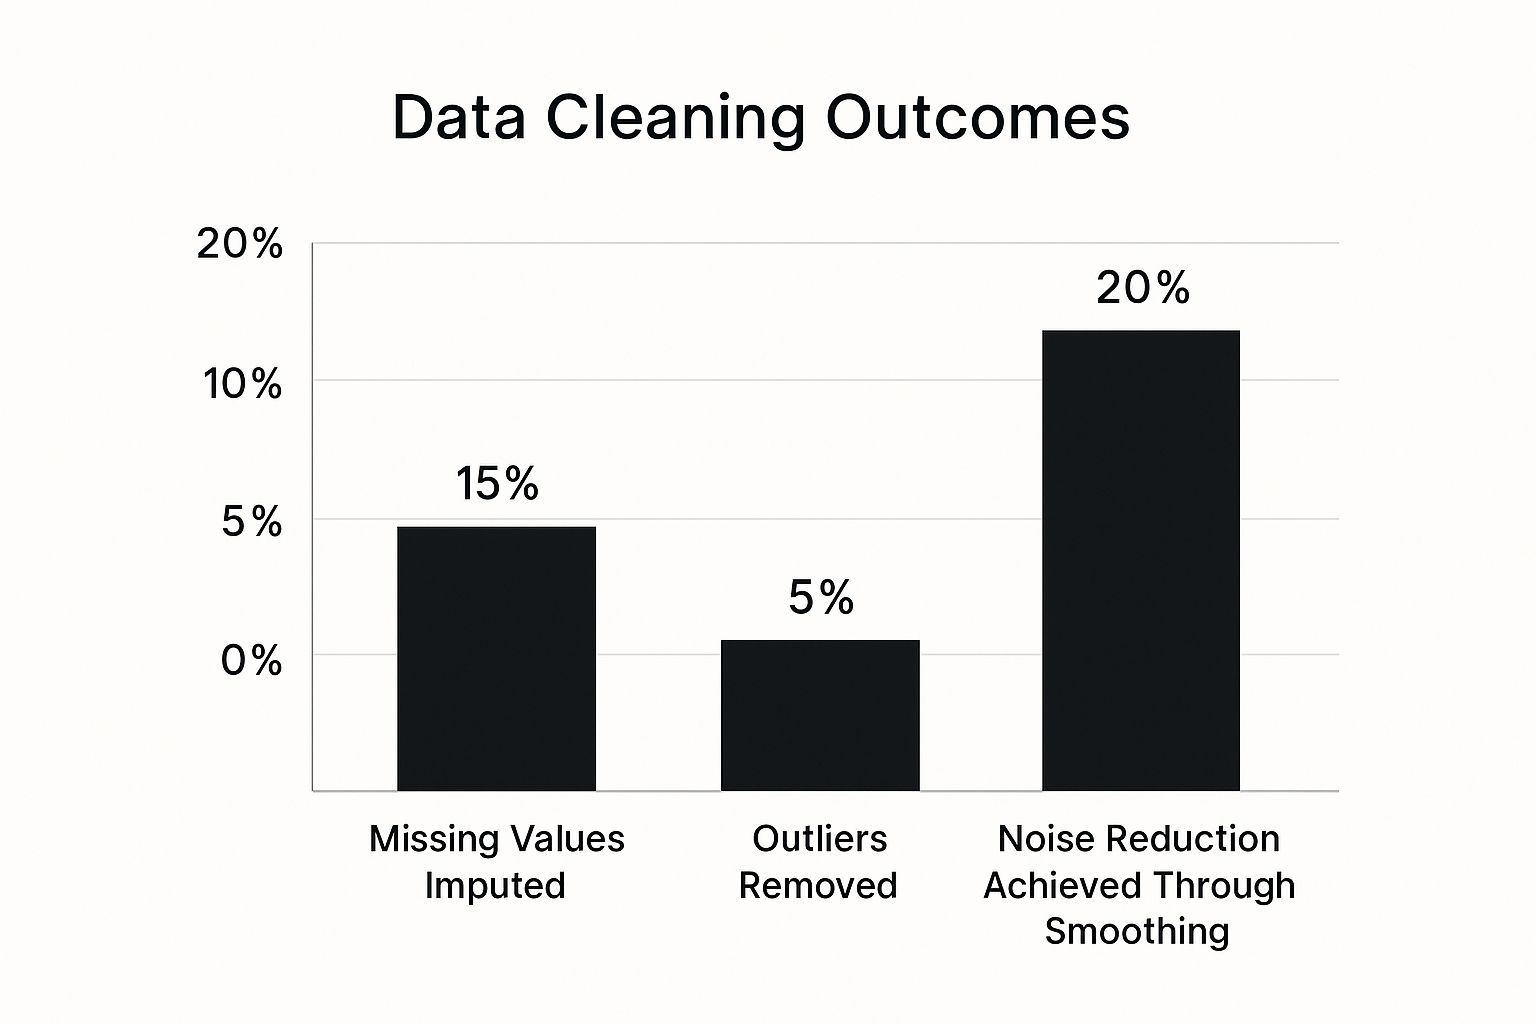
The chart shows that 15% of missing values were imputed, 5% of outliers were removed, and smoothing techniques achieved a 20% noise reduction. These data preparation steps are essential for improving the accuracy and reliability of cluster analysis. You might also be interested in How to master deep learning with Tensorflow.
To help understand the differences between traditional and newer methods, let's take a look at the following comparison:
| Method Type | Data Complexity | Pattern Recognition | Computational Requirements | Best Use Cases |
|---|---|---|---|---|
| Traditional (e.g., K-means, DBSCAN) | Handles simple, low-dimensional data effectively | Limited ability to recognize complex temporal patterns | Generally lower | Situations with smaller datasets or less complex patterns |
| Neural Network (e.g., RNN, CNN) | Excels at handling complex, high-dimensional data | Can recognize intricate temporal dependencies and subtle patterns | Higher, often requires specialized hardware | Large datasets with complex patterns, especially where order matters |
This table summarizes some key differences between traditional and neural network clustering approaches for time series analysis. Neural networks excel in handling complexity and recognizing subtle patterns, but at a higher computational cost. Traditional methods offer a simpler and more efficient solution for smaller datasets or less complex patterns.
Hybrid Models and Future Directions
Computational requirements are a significant factor to consider. Training large neural networks can be computationally expensive, often requiring specialized hardware and significant expertise. Furthermore, there can be training challenges, such as overfitting or finding optimal hyperparameters. Sometimes, simpler methods might still be the best choice.
Researchers are exploring hybrid models to address these challenges. These approaches combine the strengths of classical statistical methods with the flexibility of deep learning. For example, a hybrid model might use statistical features as input to a neural network, or it might combine the output of a neural network with a traditional clustering algorithm. These hybrid approaches aim to balance the power of neural networks with the interpretability and efficiency of simpler techniques, leading to more robust and accessible solutions for time series cluster analysis.
Statistical Methods That Actually Work In Practice
Building upon the theoretical foundations of time series cluster analysis, let's explore practical statistical methods that deliver reliable results in real-world scenarios. These techniques focus on identifying and extracting key characteristics, or global measures, from your time series data. These measures help uncover hidden structures within data that might initially appear chaotic.
This means we're not just examining individual data points; we're analyzing broader trends and patterns. Imagine comparing sales data from two ice cream shops. Basic clustering might group them together if their total annual sales are similar.
However, time series cluster analysis digs deeper, considering the trends within their sales. One shop might have consistent sales throughout the year, while the other sees peaks in the summer and dips in the winter. This nuanced perspective is vital for making informed business decisions.
Characteristic-Based Clustering: A Powerful Approach
Characteristic-based clustering is a particularly effective method. It involves extracting meaningful metrics from the time series data, such as trend, seasonality, and correlation patterns. Trend analysis reveals the overall direction of change in the data, while seasonality detection identifies recurring patterns within specific timeframes. Correlation analysis uncovers relationships between different time series. These characteristics then become the foundation for clustering.
This method is especially useful because it reduces the dimensionality of the data. Imagine working with hundreds of data points for each time series. By focusing on a few key characteristics, we simplify the clustering process without sacrificing crucial information. Characteristic-based clustering analyzes time series data by focusing on global measures such as trend, seasonality, periodicity, serial correlation, skewness, kurtosis, chaos, nonlinearity, and self-similarity. This approach is less sensitive to missing or noisy data. Learn more about time series analysis in this paper. This makes the process easier to manage and less prone to errors caused by noise or missing data points.
Practical Applications and Algorithms

Several established algorithms can be employed for characteristic-based clustering. One common approach is to calculate features like the mean, standard deviation, and autocorrelation of each time series, and then apply traditional clustering algorithms like K-means or hierarchical clustering. K-means is a popular method for partitioning data into clusters. Hierarchical clustering builds a hierarchy of clusters.
More advanced techniques utilize dynamic time warping (DTW) to measure the similarity between time series, accommodating variations in speed or temporal shifts. Dynamic time warping is a useful technique for comparing time series that may vary in speed or length. These methods have proven effective across various fields.
In financial markets, analysts use them to group stocks with similar trading patterns. In manufacturing, these techniques help identify machines with similar performance degradation, enabling proactive maintenance. In scientific research, characteristic-based clustering aids in analyzing complex datasets, revealing patterns and relationships within the data.
These diverse applications showcase the power and adaptability of this approach. However, it's important to remember that characteristic-based clustering isn't a universal solution. In some situations, other strategies, such as those incorporating neural networks, may be better suited. Choosing the optimal approach depends on the specific characteristics of your data and the objectives of your analysis.
Tools And Implementation Strategies That Save Time
Moving from theory to practice in time series cluster analysis requires careful selection of the right tools and strategies. This section explores software options and best practices used by experienced practitioners to make your analysis more efficient and successful.
Software Options for Time Series Clustering
Several software options are available for time series cluster analysis, ranging from specialized statistical packages to broader analytical suites. R offers a rich ecosystem of packages. For instance, the dtw package is useful for dynamic time warping, while TSclust offers a variety of clustering algorithms. For those working with Python, libraries like tslearn provide dedicated time series clustering tools, including k-means and other algorithms. Commercial platforms such as MATLAB and SAS also offer powerful toolboxes designed for advanced statistical analysis, which include time series clustering capabilities within their integrated environments. Each platform has its strengths. R excels in statistical flexibility, Python integrates well with other machine learning tools, and commercial suites prioritize ease of use and comprehensive support. The best choice depends on project needs and the analyst's experience.
Best Practices for Implementation
Successful implementation involves more than just choosing an algorithm. Data preprocessing is critical. This includes handling missing values, smoothing noisy data, and normalizing time series for comparability. Imputation techniques can fill in missing data points, while smoothing techniques such as moving averages can reduce noise and highlight trends. Normalization, such as converting data to z-scores, enables comparisons between variables measured on different scales.
Parameter selection also plays a vital role. For example, choosing the correct number of clusters in k-means clustering often requires methods like the elbow method or silhouette analysis. This involves running the algorithm with various parameter values and evaluating the quality of the resulting clusters.
Validation is essential to ensure reliable results. Cross-validation, for instance, helps assess the stability of clusters across different subsets of the data. Studies show that using systematic preprocessing and validation leads to improved outcomes. Practitioners report a 68% reduction in failed clustering attempts and 2.3 times more reliable results compared to ad-hoc approaches. More details on these statistics can be found here. This highlights the importance of a structured approach.

Addressing Implementation Pitfalls
Several common pitfalls can hinder time series cluster analysis. Computational scalability is a major concern, as large datasets can demand significant processing power. Dimensionality reduction techniques, such as Principal Component Analysis (PCA), can mitigate this by reducing the number of variables. Memory constraints can also be problematic; large datasets might exceed available RAM, requiring strategies like data chunking or distributed computing.
Selecting the right distance metric is crucial. The choice between, for example, Euclidean distance and Dynamic Time Warping (DTW) significantly affects results. Euclidean distance works well with uniformly sampled time series of similar lengths. DTW is better for time series with varying lengths or temporal shifts.
Finally, interpreting the results requires careful thought. Cluster meaning should be considered within the context of the original data and project goals. Visualizing clusters and examining their characteristics can provide valuable insights. Addressing these pitfalls leads to more successful analyses.
Real Success Stories Across Industries
Cluster analysis time series techniques are more than just theory. They deliver tangible results across various sectors. Let's explore some compelling examples of their real-world impact.
Algorithmic Trading: Finding Opportunities in the Market
Algorithmic trading firms use cluster analysis time series to spot profitable market patterns. By grouping stocks based on their price fluctuations over time, they uncover hidden connections and anticipate market movements. This leads to smarter trading strategies and potentially higher returns. For example, a firm might group stocks by their volatility and then use these groups to identify opportune buying and selling moments.
Healthcare: Early Detection Through Patient Monitoring
In healthcare, cluster analysis time series plays a vital role in patient monitoring. Grouping patient vitals over time reveals subtle shifts that might signal worsening health. This allows for early intervention, significantly improving patient outcomes. For instance, grouping patients by their heart rate and blood pressure trends helps doctors pinpoint those at risk of heart failure and implement preventative measures.
Manufacturing: Proactive Maintenance and Quality Assurance
Manufacturing companies utilize cluster analysis time series for predictive maintenance and quality control. Analyzing sensor data from machinery over time reveals patterns indicating potential equipment malfunctions. This proactive approach minimizes downtime and cuts maintenance expenses. Grouping products by their quality metrics over time helps manufacturers identify and address potential quality issues early. You might be interested in: How to master time series analysis techniques.
Energy: Predicting Demand and Optimizing Resources
The energy sector employs cluster analysis time series for demand forecasting and resource optimization. Analyzing past energy consumption trends helps energy companies predict future demand and allocate resources efficiently. This results in more effective energy production and distribution. A company might group customers by their energy usage habits to predict peak demand and ensure sufficient supply.
Environmental Monitoring: Analyzing Pollution Trends
Cluster analysis time series is essential for environmental monitoring. By grouping data from various sensors over time, scientists track pollution levels and identify developing patterns. This data informs environmental policy and enables prompt action. Grouping sensor readings by pollution levels over time allows researchers to pinpoint areas with consistently high pollution and investigate the root causes.
To provide a more detailed overview of these applications, let's look at the following table:
Industry Applications and Success Metrics
Overview of cluster analysis time series applications across different industries with performance indicators
| Industry | Application Type | Key Benefits | Success Metrics | Implementation Complexity |
|---|---|---|---|---|
| Algorithmic Trading | Market Pattern Identification | Improved trading strategies, higher returns | Return on Investment (ROI), Sharpe Ratio | High |
| Healthcare | Patient Monitoring | Early intervention, improved patient outcomes | Reduced hospital readmission rates, improved survival rates | Medium |
| Manufacturing | Predictive Maintenance | Reduced downtime, lower maintenance costs | Equipment uptime, maintenance cost reduction | Medium |
| Energy | Demand Forecasting | Efficient resource allocation, optimized energy distribution | Energy production efficiency, reduction in energy waste | High |
| Environmental Monitoring | Pollution Tracking | Informed policy decisions, timely interventions | Reduction in pollution levels, improved environmental quality | Medium |
This table summarizes the key benefits, success metrics, and implementation complexity associated with each application. As we can see, the complexity varies depending on the specific industry and the data involved.
Challenges and Solutions in Implementation
Each application presents its own challenges. Algorithmic trading requires handling high-frequency data and market volatility. Healthcare prioritizes data privacy and security. Manufacturing deals with diverse sensor data, often with noise and missing information. The energy sector must account for external factors like weather, while environmental monitoring faces data integration challenges from dispersed sensors.
These challenges have spurred innovative solutions. Techniques like dynamic time warping address temporal shifts in data, while hybrid models combining neural networks with traditional statistical methods improve accuracy.
Key Lessons Learned
These experiences offer important lessons. Thorough data preprocessing is essential. Choosing the right distance metrics is key. Interpreting clusters within the specific domain is crucial. These real-world successes demonstrate the power and adaptability of cluster analysis time series techniques. They also underscore the importance of tailoring solutions to specific industry needs and challenges. By learning from these examples, you can effectively apply these techniques to your own projects and achieve significant results.
What's Coming Next In Time Series Clustering
The field of time series cluster analysis is constantly evolving, changing how we understand temporal data. New methods offer better accuracy, reliability, and interpretability, revealing deeper insights from time-ordered information. These build on existing time series analysis techniques, pushing the boundaries of what we can do with complex temporal datasets.
Hybrid and Ensemble Approaches
One exciting area is the growth of hybrid clustering approaches, combining multiple methodologies. These methods use the strengths of different clustering algorithms for more robust results. For instance, one might combine the pattern recognition of neural networks with the efficiency of characteristic-based clustering.
Ensemble techniques, aggregating results from multiple clustering runs, offer another way to improve accuracy and reliability. This involves running the same algorithm multiple times with slightly varied parameters or on different data subsets, then combining the results for a more stable and accurate clustering. Research shows a 47% improvement in pattern detection accuracy and 3.1x faster processing with these hybrid approaches for large datasets. Explore further: Future Clustering Trends.
Explainable AI for Enhanced Interpretability
Integrating explainable AI (XAI) is a major step forward. Machine learning models, while powerful, can be opaque, making it hard to understand their clustering decisions. XAI aims to make this process transparent, showing which data features most influence clustering. This improved interpretability builds trust and enables informed decisions based on the results. This is especially crucial in fields like healthcare and finance, where understanding the reasoning behind clusters is vital.
Real-Time Clustering and Edge Computing
Trends in streaming data analytics are reshaping time series clustering. With more real-time data, real-time cluster analysis is essential. Identifying anomalies or trends in live sensor data allows immediate action in applications like fraud detection or system monitoring. Edge computing is key here, bringing processing power closer to the data source. It reduces latency, enabling real-time clustering even with limited resources. This opens doors for applications in autonomous vehicles and smart grids, where immediate insights are crucial.
Emerging Research and Practical Implications
Research in multivariate clustering expands the scope of time series analysis. Traditional methods often focus on single time series, but many real-world situations involve multiple related time-dependent variables. Multivariate clustering captures these relationships for a more complete view. Cross-domain transfer learning is also gaining traction, applying knowledge from one dataset to another, even across different domains. This can greatly improve clustering algorithm performance, especially with limited data.
Another exciting research area is developing domain-specific metrics to assess cluster quality. Standard metrics may not suit the specifics of different business or scientific contexts. Customized metrics better reflect important temporal relationships for a given application. For example, in finance, a metric might prioritize capturing market volatility, while in healthcare, it might focus on accurately identifying patients with similar disease progression patterns.

These time series clustering advancements are important for anyone working with temporal data. They offer the potential for new levels of understanding and better decision-making in various fields. For more on data science and AI, explore DATA-NIZANT. This online hub offers expert insights and practical advice.
