Advanced Apache Pinot: Optimizing Performance and Querying with Enhanced Project Setup
- Apache Pinot Series Summary: Real-Time Analytics for Modern Business Needs
- Advanced Apache Pinot: Custom Aggregations, Transformations, and Real-Time Enrichment
- Apache Pinot for Production: Deployment and Integration with Apache Iceberg
- Advanced Apache Pinot: Optimizing Performance and Querying with Enhanced Project Setup
- Advanced Apache Pinot: Sample Project and Industry Use Cases
- Pinot™ Basics
Originally published on November 30, 2023
In this third part of our Apache Pinot series, we’ll focus on performance optimization and query enhancements within our sample project. Now that we have a foundational setup, we’ll add new features for monitoring real-time data effectively, introducing optimizations that make queries faster and more efficient.
Enhancing the Sample Project: Real-Time Analytics with Aggregations and Filtering
In this version of the sample project, we’ll continue with our social media analytics setup, adding fields and optimizing tables to support complex aggregations and filtering on geo-location for more detailed insights.
New Project Structure Enhancements:
data: Additional sample data for testing optimizations.config: Revised schema and table configurations with new indices.scripts: New scripts for testing optimized queries and monitoring.monitoring: Configuration for setting up Pinot’s monitoring tools, tracking query times, and server metrics.
Advanced Table Configuration for Better Performance
Updated Data Schema with Additional Fields
We’ll add fields such as interaction_type (like, comment, share), app_version, and device_type to allow more granular insights into user interactions. Update social_media_schema.json as follows:
Optimized Table Configuration with Star-Tree Index
To support faster queries, we’ll enable Star-Tree indexing on frequently queried fields, such as interaction_type and geo_location. Update social_media_table.json as follows:
New Project Feature: Query Monitoring and Performance Tracking
An essential aspect of working with real-time analytics is the ability to monitor query performance and track server health.
Setting Up Pinot Monitoring
- Enable Metrics Collection: Add Pinot’s built-in monitoring capabilities to collect metrics for query latency, memory usage, and segment health.
- Use Third-Party Monitoring: Connect Pinot’s metrics with Prometheus or Grafana for an intuitive visualization of query performance. Configure Pinot’s metrics to send data to a Prometheus instance, then visualize it with Grafana dashboards.
Monitoring Setup Commands
To run Prometheus and Grafana alongside Pinot:
Enhanced Data Flow and Architecture with Star-Tree Indexing
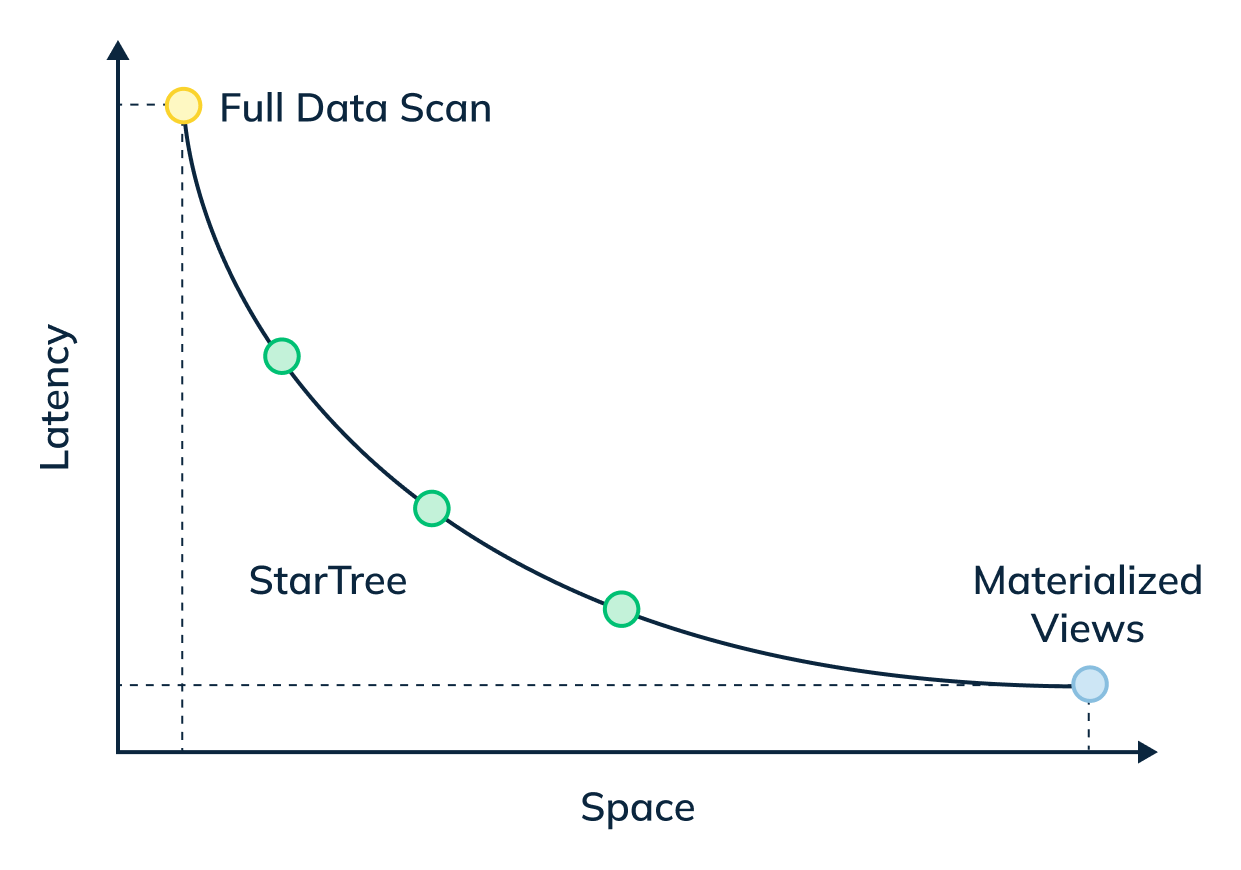
The graph below shows the performance gain and space cost for the different techniques. On the left side, we have indexing techniques that improve search time with limited increase in space, but do not guarantee a hard upper bound on query latencies because of the aggregation cost. On the right side, we have pre-aggregation techniques that offer hard upper bound on query latencies, but suffer from exponential explosion of storage space.
Hence the Star-Tree data structure inspired by the star-cubing paper (Xin, Han, Li, & Wah, 2003) that offers a configurable trade-off between space and latency and allows us to achieve a hard upper bound for query latencies for a given use case is the preferred indexing technique.
Data Flow with Star-Tree Index Optimizations
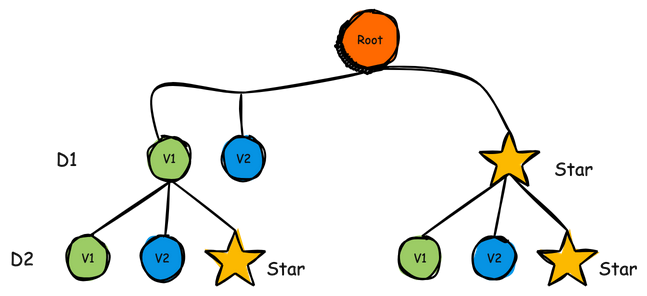
The updated architecture now includes the Star-Tree index, a powerful way to pre-aggregate data and reduce response times for complex queries. Here’s how the data flows with this index enhancement:
- Data Generation: As users interact with the application, data events are pushed to Kafka, tagged with attributes like
interaction_typeandgeo_location. - Ingestion & Indexing: Pinot’s real-time ingestion pulls events from Kafka and pre-aggregates data into Star-Tree nodes, creating partial aggregations that drastically speed up queries on high-cardinality fields.
- Optimized Querying: The Star-Tree index enables faster aggregations, making queries for metrics such as likes, shares by
geo_locationorinteraction_typealmost instantaneous.
Advanced Querying with Aggregations and Filtering
With our schema optimized, let’s test more complex queries that illustrate Pinot’s capabilities.
Examples of Optimized Queries
- Top Geo-Locations by Total Interactions:
- Most Active Device Types in the Past Week:
- Version-Based Engagement:
Conclusion
In this post, we explored advanced configurations in Apache Pinot, focusing on Star-Tree indexing and performance monitoring. These optimizations enhance our project’s ability to handle real-time analytics at scale, providing actionable insights almost instantly. By understanding these optimizations, you’re well on your way to building a robust, real-time analytics platform with Pinot.
Stay tuned for the next post, where we’ll explore deploying Pinot in a production environment and integrating it with real-world data sources.


